Harman measurements for thermoelectric materials and modules under non-adiabatic conditions
Harman measurements for thermoelectric materials and modules under non-adiabatic conditions"
- Select a language for the TTS:
- UK English Female
- UK English Male
- US English Female
- US English Male
- Australian Female
- Australian Male
- Language selected: (auto detect) - EN
Play all audios:
ABSTRACT Accuracy of the Harman measurement largely depends on the heat transfer between the sample and its surroundings, so-called parasitic thermal effects (PTEs). Similar to the material
evaluations, measuring thermoelectric modules (TEMs) is also affected by the PTEs especially when measuring under atmospheric condition. Here, we study the correction methods for the Harman
measurements with systematically varied samples (both bulk materials and TEMs) at various conditions. Among several PTEs, the heat transfer via electric wires is critical. Thus, we estimate
the thermal conductance of the electric wires, and correct the measured properties for a certain sample shape and measuring temperature. The PTEs are responsible for the underestimation of
the TEM properties especially under atmospheric conditions (10–35%). This study will be useful to accurately characterize the thermoelectric properties of materials and modules. SIMILAR
CONTENT BEING VIEWED BY OTHERS MEASURING THERMOELECTRIC MODULE PROPERTIES BY TIME-DOMAIN IMPEDANCE SPECTROSCOPY USING HEAT LEAKAGE AT 300 K Article Open access 22 March 2025 HIGH-PERFORMANCE
THERMOELECTRICS AND CHALLENGES FOR PRACTICAL DEVICES Article 21 October 2021 MICRO-THERMOELECTRIC DEVICES Article 27 June 2022 INTRODUCTION The Harman method assesses the thermoelectric
(TE) figure-of-merit, _Z_ = _α_2/_ρk_ of a material or a TEM simply based on its voltage responses to an alternating current (AC) and a direct current (DC), where _α_ is the Seebeck
coefficient, _ρ_ is the electrical resistivity, _k_ is the thermal conductivity, and _T_ is the absolute temperature1. Unlike the separate measurements2 of _α_, _ρ_, and _k_, the Harman
method requires a single apparatus and a single sample preparation, hence essentially involves smaller uncertainties in the measurements3. However, the accuracy of the Harman method has
often been questioned, as it is highly sensitive to the heat transfer from or to the sample and the electrical contact resistance3,4,5,6,7,8,9. Without correcting the parasitic thermal
effects (PTEs) in the Harman method, _Z_ measured for a single material could vary more than 50% among the samples with different dimensions or different electrical contact
configurations3,6,8. At any temperature, heat transfer significantly affects the Harman measurement. Even with thin electric wires (diameters of few tens of μm), the heat flows via the wires
reduce the temperature gradient across the specimen as well as DC voltage response3,6,8. Simply reducing the thermal conductance of the electric wires would not completely solve the
problem, as it mostly leads to the increases of the electrical resistance and also Joule heating of the wires. Radiative heat transfer considerably increases at high temperature, if the
sample and the surrounding are at different temperatures3,4,7,9. Thus, the use of radiation shield is helpful to lower the error due to the radiation below few percentages4,7. Convective
heat transfer also disturbs the temperature distribution within the sample, and can cause an unpredictable impact. There have been various efforts to correct the PTEs involved in the Harman
method3,4,6,8,9,10. Heat transfer models that account for the TE effects and the PTEs were presented3,4,6,8,9,10. Models predict that a sample with smaller thermal conductance, i.e. a sample
with longer and narrower shape, is subject to larger heat flow through the electric wires, which, in turn, results in larger underestimation of _Z_3,6,8,10. To correct the PTEs, the
dependence of error on the sample geometry was experimentally studied, and correction factors were estimated6. Another correcting scheme is to fit the measured AC and DC voltage responses to
the theoretical model, which requires additional physical properties such as Seebeck coefficient or emissivity3,8,10. Although the Harman method has been popularly used to evaluate _Z_ of
TEMs11,12, there has been much less attention to the influence of the PTEs on these measurements. As the TEMs use thick electric wires (diameters of few mm), the thermal loss would not be
negligible. If the electric resistance (_R_) of the TEM is few tens of mΩ, the electrode resistance and contact resistance would also be important. In addition, the thermal loss in
atmospheric condition is expected to be great regardless of the TEM sizes. Here, we investigate the temperature-dependent PTEs on the Harman method both for the bulk materials and TEMs. We
model the heat transfer involved in the Harman measurement, and fit to the extracted temperature gradient (Δ_T_) and measured _Z_. By measuring the samples with systematically varied sizes,
the thermal properties related to PTEs and correction factors are uncovered at various temperatures. SAMPLE PREPARATION MATERIAL SAMPLES Test materials are Bi2Te3−_x_Se_x_ (n-type) and
Bi2−_x_Sb_x_Te3 (p-type) fabricated via various processes such as hot extrusion, spark plasma sintering (SPS)13, and hot press14. As the TE properties such as _α_, _ρ_, and _k_ of the
materials all affect the PTEs3,4,5,6,8,9,10, testing several materials enables to see the link between the PTEs and TE properties, and helps to confirm the validity of the developed method.
For various-temperature measurements (300~380 K), we especially employed three types of test materials fabricated by hot-extrusion method. Table 1 lists the physical properties at 300 K and
geometries of these samples. Figure S1 (supplementary information) shows _α_ and _ρ_ measured over the entire temperature range. In addition to these materials, we also tested materials
fabricated by SPS and hot-press technique (cross-section area of 2 × 1.6 mm2) for room-temperature measurements. To systematically assess the influence of electrical and PTEs on the Harman
measurement, we prepared different sizes of samples. For each type of the test materials, we cut the sample to shorter length (_L_) while keeping the same area (_A_), and conducted further
measurements. TEM SAMPLES TEMs consist of multiple π-shaped thermocouples that are connected electrically in series and thermally in parallel. These thermocouples are sandwiched between two
substrates. Table 2 summarizes the detail information for the TEMs. Figure S2 (supplementary information) shows _α_ and _ρ_ of the thermocouple materials measured over the entire temperature
range. To vary the electrical and thermal resistance of TEMs, we fabricated four samples with different numbers of thermocouples (2, 4, 8, and 12) employing Cu/epoxy substrates. To study
the substrate effect, we also prepared two other TEMs using Al2O3 and Si/SiO2 substrates which include 12 thermocouples. OVERVIEW OF HARMAN MEASUREMENT MATERIAL MEASUREMENT A sample is
suspended by two pairs of Cu wires in a 5-mm-thick quartz vacuum chamber (≤10−4 Torr). One pair of Cu wires serves voltage probes and another pair of wires supplies current (_I_ = 25 mA) to
the sample. The Cu wires are ~30 mm long with a diameter of 50 μm. Cu foils (thickness of ~500 μm) are attached at each sample end surface to ensure uniform current distribution. Measurement
of _V__AC_ provides the electrical resistivity (_ρ__t_), and an additional measurement of _V__DC_ gives TE figure-of-merit (_Z_). Details of the Harman measurement are available
elsewhere3,8. For the various-temperature measurements, a sample is positioned within a graphite radiation shield (_d_ = 30 mm, _L_ = 40 mm) that is again located within the vacuum chamber.
The vacuum chamber is radially surrounded by six halogen lamps (_d_ = 10 mm, _L_ = 150 mm) with a radial gap distance of 20 mm. The halogen lamps are vertically centered with the radiation
shield and are fixed by a surrounding insulation material. Temperature of the shield, _T__0_, is measured by an inserted K-type thermocouple, and is controlled by a PID controller. To ensure
the stability and uniformity of the temperature, we initiated all the measurements after maintaining the temperature over 30 minutes. We ramped the temperature from ~300 K to 380 K with an
interval of ~30 K. TEM MEASUREMENT TEM measurements follow the same measuring protocol to the materials except the type of the electric wires. For a TEM, not the thin Cu wires but a pair of
stranded lead wires (_d_~1 mm) are directly soldered to the TEM electrodes. As the Harman measurement requires four electrical terminals, the ends of the stranded wires are split to four
pieces. For a small-size TEM, the electrical resistance of the stranded wires is not negligible. Thus, to eliminate the influences of the electric wire resistance (_R__wire_), we first
measure _R__wire_, and subtract _IR__wire_ from all the measured voltage data. For estimating the influence of the convective heat flow, we measured the TEMs under both an atmospheric and
vacuum condition. For measuring a TEM above 100 °C, the melting point of the solder is critical. In-Sn, Bi-Sn, or other In based solders melt near 100 °C such that the TEMs made with such
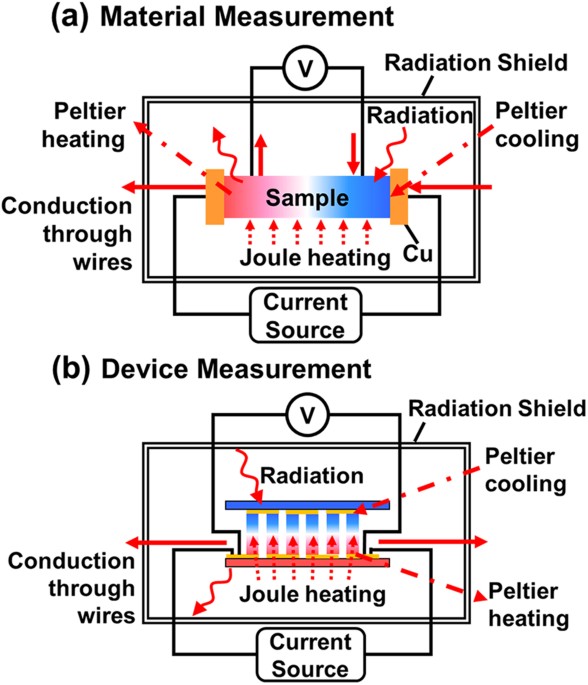
solders are not suitable for the high-temperature measurements. THEORY MODEL FOR MATERIAL MEASUREMENT Figure 1 shows the schematics for the heat transfer models. Heat transfer models
consider the DC measurement configuration where Peltier effects, Joule heating within the sample, conduction via electric wires, and radiation from or to the sample are the dominant thermal
effects. For a material measurement, the relation between the intrinsic _Z_ (_Z__i_) and the measured _Z_ (_Z__m_) is as below8: where _β_ is the radiative heat transfer coefficient, _P_ is
sample perimeter, is an average temperature across the sample, and _K_ is the thermal conductance. The subscripts _t_ and _w_ indicate the test material and electric wire, respectively.
Although the square bracket contains a second order polynomial of _L_/_A_, 1/_Z__m_ empirically is a linear function of _L_/_A_3,6,8, implying that Δ_T_ could be a first or second order
polynomial of _L_/_A_. Theoretically, Δ_T_ is described by a hyperbolic function of _L_ as shown in Fig. S3 (supplementary material), and has similar trend to the second order polynomial.
Our observations of Δ_T_ based on Δ_T_ = (_V__dc_−_V__ac_)/(_α__t_−_α__w_) have also shown that Δ_T_ fits well with the second order polynomial of _L/A_. Thus, we define a correction
factor,_η_, as a linear function of _L_/_A_. Eq. 2 explicitly indicates that the linear extrapolation of _Z__m_ to _L/A_ = 0 gives _Z__i_. The slope of _η_, _η_′ = _dη/d_(_L_/_A_), depends
on the temperature-dependent physical properties, especially on _K__w_/2 _k__t_. In Eq. 1, if −_T__0_ < 1 K and _I__2_ _ρ_~μ Wcm, the second term in the square bracket is about two orders
of magnitude smaller than the third term (see Fig. S4 in supplementary material). Eq. 1 can be further simplified. If Cu electric wires (_α__Cu_ = 1.8–2.8 μV/K at 300 K ≤ _T_ ≤ 500 K) are
used for a sample with _α__t_~200 μV/K, [_α__t_/(_α__t_−_α__w_)]2 becomes ~1. Thus, for the Harman measurement using a highly efficient TE material with a good radiation shield, a simplified
form of _η_ exists as Eq. 3 implies that the Harman method error due to the PTEs can be small when _K__t_ overwhelms _K__w_. However, practically it is difficult to achieve _K__t_ ≫ _K__w_,
since too thin electric wires would result in Joule heating and more difficulty in the electric wire welding on the sample. To determine _k__t_ and _K__w_, Eq. 1 is modified by substituting
_Z__i_ with _α__t__2_/_ρ__t__k__t_. If 1/_Z__m_ is available as a function of _L/A_, the measured data can be fitted to Eq. 4. For this fitting, _α__t_ should be measured independently, and
_ρ__t_ and Δ_T_ should be extracted from _V__ac_ and _V__dc_, respectively. If ~_T__0_, then only unknowns in Eq. 4 are _k__t_ and _K__w_. Fortunately, _k__t_ is a factor for the y-axis
intercept and _K__w_ is a factor for the slope in Eq. 4. The fitted _k__t_ is used to calculate _Z__i_. MODEL FOR TEM MEASUREMENT Figure 1b shows the schematic for the TEM measurement.
Unlike the material measurement configuration, the electric wires are at only one side of the sample. Based on the one-dimensional (1D) heat transfer model for a TEM15, an energy balance at
the hot-side substrate is as following. where _h_ is the convective heat transfer coefficient. The subscripts _M_ and _h_ denote the TEM and the hot-side substrate, respectively. Eq. 5 shows
that the net heat flow at the hot-side substrate is balanced with the heat dissipation via the electric wires and air convection. To estimate Δ_T_, the right-hand side of Eq.5 is simply
modified as _K__e_Δ_T_ where _K__e_ combines _K__w_, _hA_, and the ratio between Δ_T_ and _T__h_−_T__0_. Then, Δ_T_ is expressed as Measured _α_ and _k_ of the materials estimated _α__M_ and
_K__M_. _R__M_ was acquired via the measurement of _V__ac_. Although the 1D heat transfer model effectively captures the relevant thermal phenomena, it does not account for the contribution
of the substrates. Intuitively, the thermal conductance along the substrate would affect the temperature distributions of the substrates and TE materials. Thus, we developed a
three-dimensional TE finite element model (FEM) using a commercial software package (COMSOL Multiphysics) for the TEM measurement. The model calculates the temperature and electrical field
distributions when DC is applied. To simulate the heat flow via electric wires, one of the substrates is subject to a uniform heat flux which is equal to _K__w_(_T_−_T__0_)/_A_, where _K__w_
is obtainable by fitting the calculated data to the experimental data. As a thermal boundary condition, the other substrate temperature is set to _T__0_. Since the FEM simulates the
measurement under vacuum condition, all other surface area of a TEM is thermally insulated. As an electrical boundary condition, one of the TEM electrode is electrically grounded, while the
other TEM electrode serves as a DC current source. To electrically insulate the substrate, the electrical conductivity and Seebeck coefficient of the substrates are set to zero. Other
details of FEM are included in the supplementary information. RESULTS AND DISCUSSION I: MATERIAL MEASUREMENT Through measuring _Z_ as a function of the sample size, we observe the PTEs both
in the material and TEM measurements. By comparing the model with the measured data, we aim to understand how the PTEs are determined and corrected. Figure 2 shows 1/_Z__m_ of the test
materials as a function of _L_/_A_. As Eq. 2 predicts, 1/_Z__m_ shows a linear dependence on _L_/_A_ for all the temperatures and material types. The y-axis intercepts correspond to
1/_Z__i_, and are used to determine _k__t_. Based on Eq. 4, the slopes are related to _K__w_, hence the slope would change if different types of electric wires or wiring processes are
employed. Here, the samples seem to possess comparable _ρ__t__K__w_/(_α__t_−_α__w_)2 each other such that the slopes are similar when the measuring temperatures are identical. By fitting Eq.
4 to the experimental data, TE properties and _K__w_ are uncovered. For this fitting, Δ_T_ is extracted from _V__dc_ and _V__ac_ as shown in Fig. 3a. _K__w_ and _k__t_ are simultaneously
fitted by the least square method. Figure 3b shows that _K__w_ for various materials are similar with a deviation, _σ_, ≤ ± 40 μW/m. The deviation of _K__w_ would result from the differences
of the electric wire length and inconsistent thermal contact resistance at the wire-sample interfaces. An average value of _K__w_ (_K__w,avg_) for the samples could be fitted to a second
order polynomial in the given temperature range. Figure 3c shows the fitted _k__t_ that turn out to be comparable to the reported values of the similar materials16,17. With these _k__t_,
_Z__i_ is obtainable as shown in Fig. 3d, and Δ_T_ can also be calculated as shown in Fig. 3a. The calculated Δ_T_ are close to the experimentally extracted Δ_T_, indicating that fitted
_K__w_ and _k__t_ are reasonable values. Assuming that the PTEs are continuous functions of the temperature and the sample geometry, the correction factor, _η_, for an arbitrary _L_/_A_ and
_T_ is predictable with discrete values of _η_. Figure 4a and b show _η_′ and _η_ for the test materials. By fitting the discrete values of _η_′ to a polynomial, _η_′ could be interpolated
within the relevant temperature range for the particular type of material. Interestingly, type 1 and 2 show similar _η_′, while type 3 exhibits comparatively large _η_′. The deviation of
_η_′ between the samples is due to the difference of the ratio of _K__w_ to _k__t_ as Eq. 3 indicates. Since _k__t_ of the samples are similar, here _K__w_ is a key factor for _η_′. If _η_′
is estimated with _K__w,avg_, the deviation of _η_′ becomes much smaller (<10%), implying that the uncertainty of _K__w_ is critical for _η_′. Figure 4c and d show how the uncertainty of
_K__w_ affects the uncertainties of estimated _k__t_ and _Z_, especially for type 1 with _L_/_A_ = 2.9/mm. To estimate the influence of the _K__w_ uncertainty, we corrected the raw data
using two different _K__w_: (1) _K__w_ that were particularly fitted for type 1 (_K__w,1_), and (2) _K__w,avg_. Although _K__w,avg_ is ~10% larger than _K__w,1_, _k__t_ and _Z_ corrected by
the two _K__w_ exhibit ~5% deviations to each other. Therefore, fortunately, the uncertainty of _K__w_ seems to give reduced impact on the uncertainties of _k__t_ and _Z_. To further reduce
the uncertainties for correcting _k__t_ and _Z_, a reliable and consistent electrical contact should be necessary. Another approach would be to measure a sample with small _L/A_ where _η_ is
small such that the absolute influence of the _K__w_ uncertainty becomes negligible. RESULTS AND DISCUSSION II: TEM MEASUREMENT Figure 5 shows the TE properties of the TEMs as a function of
the thermocouple number (_n_). Measured electrical resistance of the TEMs (_R__M_) increases with _n_ which is the sum of the resistances of TE materials (_R__TE_), electrodes (_R__elec_),
and contact resistance at the interfaces (_R__cont_). Here, _R__cont_ was estimated by _R__M_−_R__TE_−_R__elec_. As _n_ becomes small, _R__elec_ and _R__cont_ decrease without exhibiting
complete linear-trends. The nonlinearity arises from the fact that the total length of the TEM electrodes does not increase linearly with _n_ and the soldering quality would vary without an
automated TEM fabrication. In our case, _R__cont_/_n_ is ~2 mΩ. As _Z_ is determined by _α__M_Δ_T_/_IR__M_, the relative magnitude of _R__elec_ + _R__cont_ should be small for _Z_ to be
large. Heat flow through the electric wires (_Q__w_) affects the temperature gradient within the TEM as well as the estimated _Z_. As the impact of _Q__w_ is not the intrinsic property of
the TEM, the measured _Z_ should be calibrated by a factor of (_K__M_ + _K__e_)/_K__M_, especially for a small-sized TEM. Figure 5b shows that experimentally extracted Δ_T_ slightly reduces
as _n_ decreases. Eq. 6 predicts well the dependence of Δ_T_ on _n_ employing a single value of _K__e_ (=500 μW/K). If _Q__w_ is 0 (ideal condition which is equivalent to _K__e_ = 0), then
Δ_T_ should be a constant regardless of _n_. When _Q__w_ is not 0 (realistic condition) and a TEM has small _n_, however, _K__M_is small (e.g. _K__M_~7 mW/K for _n_ = 2) such that the
influence of _Q__w_ becomes important. Thus, if comparing the measured _Z_ (_Z__m_) and the calculated _Z_ with _Q__w_ = 0 (_Z__adiabatic_), they differ 5–10% for small TEMs. On the other
hand, for large TEMs (_K__M_/_K__w_ > 50), the influence of _Q__w_ becomes small, hence the difference between _Z__m_ and _Z__adiabatic_ reduces to less than 1%. For the TEM measurement
in air, the convective heat transfer (_Q__conv_) becomes important, and causes seriously underestimated _Z_. Figure 6a and b show the measured Δ_T_ and _Z_ of the TEMs at 300 K. The data
measured in air is 10–35% lower than the data acquired in vacuum, although the deviation decreases with larger _n_. The contribution of _Q__conv_ could be estimated by calculating Δ_T_. With
_K__e_ of 4 mW/K, Δ_T_ measured in air were fitted. With this _K__e_ and the TEM substrate area, the convective heat transfer coefficient for this TEM measurement was estimated as ~20
W/m2K. The deviation between the data measured in vacuum and air slightly increases as the measuring temperature increases. Figure 6c and d show Δ_T_ and _Z_ of the TEMs with _n_ = 12.
Although the influence of _Q__w_ is not great, the effect of _Q__conv_ is evident by causing an error of ~10%. Another concern in the TEM measurement is the substrate effect. Intuitively,
highly conductive substrate is likely to increase _Q__w_ as it spreads heat well. Figure 7a shows the temperature distribution calculated by the FEM for a TEM with _n_ = 2 and alumina
substrates. Likewise, the temperature profiles along the substrates were calculated for other types of substrate as shown in Fig. 7b. The calculated result shows that the difference of the
temperature profiles among the substrate materials is ≤1 mK. The substrate type seems not make meaningful difference, as any substrate type used here has sufficiently large in-plane thermal
conductance. _K__w_ for the calculation was obtained by fitting _Z_ to the measured data as shown in Fig. 7b. _K__w_ was in the range of 100–200 μW/K. Figure 7c shows the measured and
calculated _Z_ of the TEMs where the deviation of the measured data is mostly due to the variations of the TE material properties. However, it should be noted that the substrate effect might
become important if the in-plane thermal resistance of the substrate (_R__th,sub_) is relatively large as compared to the total thermal resistance of the TEM (_R__th,TEM_). For the TEMs
used in this study, _R__th,sub_ is ~6–65% of _R__th,TEM_. If the substrate thickness reduces to few tens of μm or the TE leg length reduces an order of magnitude, _R__th,sub_/_R__th,TEM_
will become much larger than unity, and the heat transfer across the substrate would affect _Q__w_ and the Harman measurement. CONCLUSIONS The effect of the PTEs in the Harman measurement
was investigated theoretically and experimentally. For the material measurement, the dependence of 1/_Z__m_ on _L_/_A_ becomes linear if the radiative heat transfer and Joule heating are
constricted well by employing a radiation shield and small current. By fitting the model to 1/_Z__m_ at discrete _L_/_A_s and _Ts_, a continuous correction factor is predictable, which is
useful to correct _Z_ and thermal conductivity for a certain _L_/_A_ and _T_. However, the uncertainty of the correction depends on the uncertainty of _K__w_, which is difficult to
accurately estimate. For the TEM measurement, the heat flow through electric wires and air are also important. Especially, when the thermal conductance between the TEM and the environment
becomes relatively large (_K__e_/_K__M_ > 10%), the measurement error could be significant (10–35%). Thus, an adiabatic condition and a proper correction are critical to characterize the
intrinsic TE properties of the TEM. This work will be helpful to characterizing the TE materials and modules, and understanding the sample-size dependent data. ADDITIONAL INFORMATION HOW TO
CITE THIS ARTICLE: Roh, I.-J. _et al_. Harman Measurements for Thermoelectric Materials and Modules under Non-Adiabatic Conditions. _Sci. Rep._ 6, 39131; doi: 10.1038/srep39131 (2016).
PUBLISHER'S NOTE: Springer Nature remains neutral with regard to jurisdictional claims in published maps and institutional affiliations. REFERENCES * Harman, T. C. Special techniques
for measurement of thermoelectric properties. J. Appl. Phys. 29, 1373–1374 (1958). Article ADS CAS Google Scholar * Wang, H. et al. International round-robin study of the thermoelectric
transport properties of an n-type half-heusler compoundfrom 300 k to 773 k. J. Electron. Mater. 44, 4482–4491 (2015). Article ADS CAS Google Scholar * Kang, M.-S. et al. Correction of
the electrical and thermal extrinsic effects in thermoelectric measurements by the harman method. Sci. Rep. 6, 26507 (2016). Article ADS CAS PubMed PubMed Central Google Scholar * Ao,
X., de Boor, J. & Schmidt, V. Radiation-corrected harman method for characterization of thermoelectric materials. Adv. Energy Mater. 1, 1007–1011 (2011). Article CAS Google Scholar *
Castillo, E. E., Hapenciuc, C. L. & Borca-Tasciuc, T. Thermoelectric characterization by transient harman method under nonideal contact and boundary conditions. Rev. Sci. Instrum. 81,
044902 (2010). Article ADS CAS PubMed Google Scholar * Champness, C. H. & Parekh, P. C. Size-dependent errors in z determination using the harman method. Can. J. Phys. 43, 1589–1603
(1965). Article ADS CAS Google Scholar * Kraemer, D. & Chen, G. High-accuracy direct zt and intrinsic properties measurement of thermoelectric couple devices. Rev. Sci. Instrum. 85,
045107 (2014). Article ADS CAS PubMed Google Scholar * Kwon, B., Baek, S.-H., Keun Kim, S. & Kim, J.-S. Impact of parasitic thermal effects on thermoelectric property measurements
by harman method. Rev. Sci. Instrum. 85, 045108 (2014). Article ADS CAS PubMed Google Scholar * Vasilevskiy, D., Simard, J.-M., Masut, R. & Turenne, S. System for simultaneous
harman-based measurement of all thermoelectric properties, from 240 to 720 k, by use of a novel calibration procedure. J. Electron. Mater. 44, 1733–1742 (2014). Article ADS CAS Google
Scholar * Penn, A. W. The corrections used in the adiabatic measurement of thermal conductivity using the peltier effect. J. Sci. Instrum. 41, 626 (1964). Article ADS Google Scholar *
Iwasaki, H. et al. Evaluation of the figure of merit of thermoelectric modules by harman method. Jpn. J. Appl. Phys. 42, 3707–3708 (2003). Article ADS CAS Google Scholar * Wang, H.,
McCarty, R., Salvador, J., Yamamoto, A. & König, J. Determination of thermoelectric module efficiency: A survey. J. Electron. Mater. 43, 2274–2286 (2014). Article ADS CAS Google
Scholar * Lim, S.-S. et al. Effect of spark plasma sintering conditions on the thermoelectric properties of (Bi0.25Sb0.75)2Te3 alloys. J. Alloy. Compd. 678, 396–402 (2016). Article CAS
Google Scholar * Lee, J.-U. et al. Effect of sn doping on the thermoelectric properties of n-type Bi2(Te,Se)3 alloys. J. Electron. Mater. 44, 1926–1930 (2015). Article ADS CAS Google
Scholar * Rowe, D. M. Crc handbook of thermoelectrics. (CRC Press, 1995). * Fan, X. A. et al. Preferential orientation and thermoelectric properties of p-type Bi0.4Sb1.6Te3 system alloys by
mechanical alloying and equal channel angular extrusion. J. Alloy. Compd. 461, 9–13 (2008). Article CAS Google Scholar * Yan, X. et al. Experimental studies on anisotropic thermoelectric
properties and structures of n-type Bi2Te2.7Se0.3 . Nano Lett. 10, 3373–3378 (2010). Article ADS CAS PubMed Google Scholar Download references ACKNOWLEDGEMENTS This work was supported
by the R&D Convergence Program of National Research Council of Science and Technology of Republic of Korea. AUTHOR INFORMATION AUTHORS AND AFFILIATIONS * Center for Electronic Materials,
Korea Institute of Science and Technology (KIST), Seoul, 02792, Republic of Korea Im-Jun Roh, Yun Goo Lee, Min-Su Kang, Jae-Uk Lee, Seung-Hyub Baek, Seong Keun Kim, Dow-Bin Hyun, Jin-Sang
Kim & Beomjin Kwon * Display and Nanosystem Laboratory, College of Engineering, Korea University, Seoul, 02841, Republic of Korea Yun Goo Lee, Min-Su Kang & Byeong-Kwon Ju *
Department of Nanomaterials Science and Technology, Korea University of Science and Technology, Daejeon, 34113, Republic of Korea Seung-Hyub Baek Authors * Im-Jun Roh View author
publications You can also search for this author inPubMed Google Scholar * Yun Goo Lee View author publications You can also search for this author inPubMed Google Scholar * Min-Su Kang View
author publications You can also search for this author inPubMed Google Scholar * Jae-Uk Lee View author publications You can also search for this author inPubMed Google Scholar *
Seung-Hyub Baek View author publications You can also search for this author inPubMed Google Scholar * Seong Keun Kim View author publications You can also search for this author inPubMed
Google Scholar * Byeong-Kwon Ju View author publications You can also search for this author inPubMed Google Scholar * Dow-Bin Hyun View author publications You can also search for this
author inPubMed Google Scholar * Jin-Sang Kim View author publications You can also search for this author inPubMed Google Scholar * Beomjin Kwon View author publications You can also search
for this author inPubMed Google Scholar CONTRIBUTIONS B.K. designed this work. I.J.R. and J.W.L. performed the Harman measurements. I.J.R. and J.W.L. fabricated the thermoelectric
materials. Y.G.L. made thermoelectric modules. B.K. carried out the theoretical calculations and M.S.K. conducted the finite element modeling. B.K., S.H.B., S.K.K., B.K.J., D.B.H., and
J.S.K. arranged and supervised all experiments. All authors discussed the results and manuscript. ETHICS DECLARATIONS COMPETING INTERESTS The authors declare no competing financial
interests. ELECTRONIC SUPPLEMENTARY MATERIAL SUPPLEMENTARY INFORMATION RIGHTS AND PERMISSIONS This work is licensed under a Creative Commons Attribution 4.0 International License. The images
or other third party material in this article are included in the article’s Creative Commons license, unless indicated otherwise in the credit line; if the material is not included under
the Creative Commons license, users will need to obtain permission from the license holder to reproduce the material. To view a copy of this license, visit
http://creativecommons.org/licenses/by/4.0/ Reprints and permissions ABOUT THIS ARTICLE CITE THIS ARTICLE Roh, IJ., Lee, Y., Kang, MS. _et al._ Harman Measurements for Thermoelectric
Materials and Modules under Non-Adiabatic Conditions. _Sci Rep_ 6, 39131 (2016). https://doi.org/10.1038/srep39131 Download citation * Received: 25 August 2016 * Accepted: 17 November 2016 *
Published: 14 December 2016 * DOI: https://doi.org/10.1038/srep39131 SHARE THIS ARTICLE Anyone you share the following link with will be able to read this content: Get shareable link Sorry,
a shareable link is not currently available for this article. Copy to clipboard Provided by the Springer Nature SharedIt content-sharing initiative
Trending News
1735 influence of maturation and hyperoxia on surfactant phospholipids and pulmonary compliance in the premature and term rabbitABSTRACT Iowa College of Medicine, Iowa City, IA 52242. Premature (29 days gestation) or term (31 days) rabbits were del...
26 psychosocial adjustment of adolescent sexual abuse victimsABSTRACT To assess adolescent psychosocial adjustment, 20 female sexual abuse victims completed the Offer Self-Image Que...
Camk2d serves as a molecular scaffold for rnf8-mad2 complex to induce mitotic checkpoint in gliomaABSTRACT MAD2 is a spindle assembly checkpoint protein that participates in the formation of mitotic checkpoint complex,...
Magnetic nanoparticle–mediated massively parallel mechanical modulation of single-cell behaviorABSTRACT We report a technique for generating controllable, time-varying and localizable forces on arrays of cells in a ...
Baseline brain metabolism in resistant depression and response to transcranial magnetic stimulationABSTRACT Neuroimaging studies of patients with treatment-resistant depression (TRD) have reported abnormalities in the f...
Latests News
Harman measurements for thermoelectric materials and modules under non-adiabatic conditionsABSTRACT Accuracy of the Harman measurement largely depends on the heat transfer between the sample and its surroundings...
Accused ceo shooter luigi mangione complained about back pain, ‘brain fog’ and other health issues in reddit postsThe Ivy League grad accused of fatally shooting UnitedHealthcare CEO Brian Thompson reportedly detailed his health woes,...
The AARP Minute: June 7, 2023Memorial Day Sale! Join AARP for just $11 per year with a 5-year membership Join now and get a FREE gift. Expires 6/4 G...
Bbc weather forecast: ice warning issued as cold weather blights ukSarah, 36, reported live from New Broadcasting House in London to deliver the weather forecast for BBC Breakfast. The BB...
Martin lewis explains whether help to buy or lifetime isa is bestMartin Lewis, 47, offered advice in ISAs to a caller on the BBC radio show yesterday. Angus, 23, asked the money saving ...