Quantitating and dating recent gene flow between european and east asian populations
Quantitating and dating recent gene flow between european and east asian populations"
- Select a language for the TTS:
- UK English Female
- UK English Male
- US English Female
- US English Male
- Australian Female
- Australian Male
- Language selected: (auto detect) - EN
Play all audios:
ABSTRACT Historical records indicate that extensive cultural, commercial and technological interaction occurred between European and Asian populations. What have been the biological
consequences of these contacts in terms of gene flow? We systematically estimated gene flow between Eurasian groups using genome-wide polymorphisms from 34 populations representing
Europeans, East Asians and Central/South Asians. We identified recent gene flow between Europeans and Asians in most populations we studied, including East Asians and Northwestern Europeans,
which are normally considered to be non-admixed populations. In addition we quantitatively estimated the extent of this gene flow using two statistical approaches and dated admixture events
based on admixture linkage disequilibrium. Our results indicate that most genetic admixtures occurred between 2,400 and 310 years ago and show the admixture proportions to be highly
correlated with geographic locations, with the highest admixture proportions observed in Central Asia and the lowest in East Asia and Northwestern Europe. Interestingly, we observed a
North-to-South decline of European gene flow in East Asians, suggesting a northern path of European gene flow diffusing into East Asian populations. Our findings contribute to an improved
understanding of the history of human migration and the evolutionary mechanisms that have shaped the genetic structure of populations in Eurasia. SIMILAR CONTENT BEING VIEWED BY OTHERS
DIFFERENCES IN LOCAL POPULATION HISTORY AT THE FINEST LEVEL: THE CASE OF THE ESTONIAN POPULATION Article Open access 25 July 2020 THE GENOMIC LANDSCAPE OF MEXICAN INDIGENOUS POPULATIONS
BRINGS INSIGHTS INTO THE PEOPLING OF THE AMERICAS Article Open access 12 October 2021 NATIVE AMERICAN GENE FLOW INTO POLYNESIA PREDATING EASTER ISLAND SETTLEMENT Article 08 July 2020
INTRODUCTION The interaction between European and Asian populations has been historically influenced by many factors, including the political conditions created by great empires such as the
Roman (31 BC–250 AD) and Mongolian empires (1207 AD–1360 AD) that fostered communication between European and Asian populations and the famous Silk Road (206 BC) which acted historically as
a commercial, religious and cultural network interlinking the trade routes across the Eurasian landmass that connected East Asia with the Mediterranean and Europe. This raises the question
of whether genetic admixture occurred during the interaction between people from different regions, particularly between Europe and East Asia. If there has been gene flow between
populations, we can, in principle, estimate the time and magnitude of this gene flow by analyzing genomic data from modern human populations. Previous studies have revealed that the
populations of Central Asia, such as Uygur, are typically admixed with genetic contributions from both European and East Asian populations1,2,3,4,5,6,7. However, only a few cases of genetic
admixture among other Eurasians, particularly between East Asians and Northwestern Europeans have been reported8,9. These studies reported the Asian or American contribution in European
populations. But the European gene flow in Asians has not been well studied yet. Here we present what is, to the best of our knowledge, a systematic investigation of genetic admixture
between different European and Asian populations using genome-wide single nucleotide polymorphism (SNP) data from 34 populations, including seven European groups (EUR), 9 Central or South
Asian groups (CSA) and 17 East Asian groups (EAS) and one Tibetan group from Tibet Plateau. Based on statistical analysis using 4 Population Test (f4-test) and 3 Population Test
(f3-test)10,11, we detected gene flow between Europeans and Asians were prevalent for most populations including even those from west-northern Europe and East Asia which have been generally
regarded as less admixed. We quantitatively estimated the magnitude of these gene flows using two different f4 statistical approaches: F4 Ratio Estimation12 and Regression Ancestry
Estimation10. And finally, we estimated the time of admixture events based on their admixture linkage disequilibrium (ALD) using _ROLLOFF_ software12. RESULTS EVIDENCE OF GENE FLOW BETWEEN
EUR AND EAS We obtained genome-wide data of 34 Eurasian populations from 1000 Genomes Project (1 KG)13, the Human Genome Diversity Panel (HGDP)14 and other studies1,15. In total, 1,132
Eurasian samples with 186,506 SNPs integrated from different technical platforms were used for analysis (see Methods). To study the signal of gene flow between West and East Eurasian
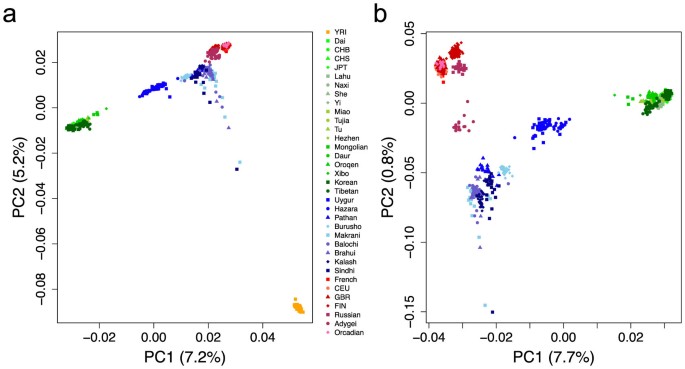
populations (European and Asian populations in Table 1), firstly we performed Principal Component Analysis (PCA)16 both with and without respectively African populations based on 96,538
random SNPs avoiding high linkage disequilibrium. We observed that some clusters of West and East Eurasians are slightly shifted towards each other, indicating potential admixture between
them (Fig. 1). There is a clear ‘cline’ between West and East clusters. These shifts of PC patterns are especially obvious for most CSA, some northern EAS including Mongolian, Xibo, Hezhen,
Oroqen etc. and eastern EUR including Russian, Finnish and Adygei. We then initiated formal testing for the presence of gene flow. We assessed the gene flow between EUR and EAS using f4-test
and f3-test for each Eurasian group. The f4-test and f3-test, which are model-based statistics, were designed to measure genetic drift along lineages quantitatively to detect gene flow
between populations10,11. In the current study, our samples did not cover all European regions. For example, Southern European populations were not included in the analysis because they may
have been affected by a recent genetic contribution from populations with African ancestry. Several studies have revealed evidence of sub-Saharan African admixture among southern European
populations but only rarely among northern European populations12,17,18. Since ancestral populations predating admixture are unavailable, an alternative is to determine proper surrogates of
ancestral EUR and EAS. We have employed an approach based on f statistics for each pair of EAS, EASi and EASj, to compare the quantitative contribution they inherited from EUR (see Methods).
We can therefore choose the least-admixed EAS as a surrogate of ancestral EAS. As a result, based on phylogeny as Supplementary Fig. S1, Dai from southern China could be considered to be a
surrogate of ancestral EAS (Fig. 2a). Similarly, we applied our approach for each pair of EUR and found French holds the less genetic contribution from EAS than other EUR and therefore can
be considered as a surrogate of ancestral EUR (Fig. 2b). We assumed a Hybrid Isolation (HI) model for admixed Eurasian populations with ancestries from both EUR and EAS, as shown in
Supplementary Fig. S1. For each group of EAS, we assessed whether the statistic _f_4(_YRI_, _French; Dai, EAS__i_), significantly deviates from zero (see Methods). If so, it should indicate
gene flow from EUR. Otherwise, the population should have entire EAS ancestry. Accordingly, we found that most EAS significantly deviated from the (_YRI_(_French, (Dai, EAS__i_))) topology
(Z-score>2) (Table 1 and Supplementary Table S1), indicating gene flow from EUR. We similarly tested EAS gene flow in each group of EUR by test _f_4(_YRI_, _Dai; French, EUR__i_) (see
Methods). Most EUR significantly violated the (_YRI_, ((_French, EUR__i__),Dai_) topology (Z-score>2) (Table 1 and Supplementary Table S1), indicating that most EUR in our study inherited
a genetic contribution from EAS ancestry. For CSA, we used two f4-tests, _f_4(_YRI_, _French, Dai; CSA__i_) and _f_4(_YRI_, _Dai; French, CSA__i_) and one f3-test _f_3(_CSA__i__, French,
Dai_). Most CSA showed an extremely significant violation of the (_YRI_, (_French,_ (_Dai, CSA__i_))) topology (Table 1 and Supplementary Table S1), which indicates that these CSA (such as
Uygur, Haraza, Pathan, Burusho, Kalash and Sindhi) are typical admixed populations with a high level of gene flow from both EUR and EAS ancestries. Different from other CSA, Makrani showed
significant signal of African ancestry. And there was no admixture signal for Brahui. QUANTITATIVE ESTIMATION OF GENE FLOW To estimate the genetic contributions of EUR and EAS ancestries, we
first performed a linear regression procedure10, which assumes that mixed populations share similar demographical histories. One Oceania population Papuan, which were not considered
experiencing any recent admixture with EUR or EAS, was added into our model as an out-group12. For EAS with phylogeny displayed in Supplementary Fig. S2, we plotted _f_4(_YRI_, _French, Dai,
EAS__i_) against _f_4(_YRI_, _Papuan_; _French, EAS__i_) and each group should fall along a line with a negative slope (equation (3)) if most groups shared same degree of drift T and W. By
carrying out the least-squares that best fit all EAS data, we could estimate the parameters of the linear model, allowing us to calculate the admixture proportion for each group. As
expected, we observed a well-fit linear model for all EAS in our study, with a correlation coefficient _r_2 = 0.8 (Supplementary Fig. S3a), which indicates that most EAS are likely to have
inherited alleles from the same ancestral populations and shared similar demographical histories (same T and W in Supplementary Fig. S2). We subsequently calculated the admixture proportion
given the values of drift T and W that could be estimated based on parameters of the linear model. An estimation of admixture proportions for each EAS is provided in Table 2. We detected 2.8
± 0.2% EUR ancestry in Northern Han Chinese (CHB), which was more than that in Southern Han Chinese (CHS; 1.7 ± 0.1%), Japanese (2.2 ± 0.2%) and Korean (1.6 ± 0.2%) populations. Northeast
Asians such as Oroqen, Mongolian, Hezhen and Daur (nomads who historically lived alongside Russians and Caucasians) inherited significantly more alleles from EUR: Mongolian 10.9 ± 0.1%,
Oroqen 9.6 ± 0.2%, Daur 8.0 ± 0.2% and Hezhen 6.8 ± 0.2%. Similarly, we plotted _f_4(_YRI_, _Dai; French, EUR__i_) against _f_4(_YRI_, _Papuan_; _EUR__i__, Dai_) for EUR, in which a linear
model provided a good fit to the data (_r_2 = 0.9) (Supplementary Fig. S3b), indicating most groups underwent the same amount of drift as measured by W and M (Supplementary Fig. S2). The
proportions of admixture from ancestral EUR and EAS were estimated and are shown in Table 2. CEU populations mostly originating from France and Germany had a small fraction (0.7 ± 0.8%) of
genetic material from EAS. People from Great Britain such as British (GBR) and Orcadian inherited 2.5%–3.8% from ancestral EAS. Finnish (FIN) and Russians inherited significantly more
genetic material (>12%) from ancestral EAS, which is consistent with their historical record of admixture with Mongolian populations. Besides, Adygei from Caucasus inherited 3.2 ± 1.0%
from ancestral EAS. This regression method was unsuitable for studying CSA, because there was no correlation between _f_4(_YRI_, _Dai; French,_ _CSA__i_) against _f_4(_YRI_, _Papuan; Dai_
_CSA__i_) which is required in this approach. We therefore performed F4 Ratio Estimation12 to calculate the admixture proportion for CSA. For each CSA (CSAi), the admixture proportion could
be estimated directly from the ratio of these two f4-tests _f_4(_YRI_, _Papuan; CSA__i_, _Dai_) and _f_4(_YRI_, _Papuan; French,_ _Dai_) (equation (4)). The results (Table 2) revealed that
CSA, located in the middle of the Eurasian continent, mostly are typical admixed populations with a high level of gene flow from EUR and EAS ancestries. Uygur from Northwest China exhibit
52.4% EUR ancestry. For those populations from Pakistan, Pathan exhibits 78.4% EUR ancestry. Burusho and Hazara have 67.9% and 50.2% EUR ancestry, respectively. Admixture proportions for
some CSA are relatively small, for which Kalash has 20.7% EUR ancestry, Sindhi 11%, Balochi 2.1%. We also performed F4 Ratio Estimation to estimate admixture proportion for EAS and EUR.
Using this method, we obtained comparable results to the regression method (Supplementary Table S2). For example, we detected 9.7% EUR ancestry in the Mongolian population. EUR ancestry is
more pronounced among Northern Han Chinese than southern Han Chinese. In addition, Russian and Finnish populations show ~13% Asian ancestry. ESTIMATION OF ADMIXTURE TIMES To provide a more
detailed description of demographical history, we attempted to estimate the time that admixture events occurred. Given the low level of gene flow for some Eurasian groups, we needed an
accurate and sensitive method to estimate admixture times. We used _ROLLOFF_, which examines pairs of SNPs and assesses how ALD decreases with genetic distance in admixed populations. We
examined each admixed EAS using _ROLLOFF_ with EAS (Dai) and EUR (French) ancestries. By fitting an exponential distribution to each run of _ROLLOFF_ with least-squares, we obtained the
number of generations since admixture. As shown in Table 2, Han Chinese (CHB) received recent genetic input from EUR approximately 48 ± 1.2 generations (1383 years) ago assuming a generation
time of 29 years19. Similarly, Korean populations received recent gene flow from EUR approximately 45 ± 3.9 generations ago. EUR gene flow reached Japanese populations 60.8 ± 31.2
generations (1,763 years) ago, which probably followed the continental migration of Yayoi that began ~2300 years ago and continued for the next 1000 years20. The admixture of EUR in Xibo
population collected in Xinjiang could be dated back to 10.7 ± 0.7 generations, or ~310 years ago. In the past, Xibo populations lived in Siberia and North-Eastern China. In the mid-18th
century, part of the Xibo population migrated to North-Western China due to the policy of guarding the frontier by the government of the Qing Dynasty. This estimation of admixture time
correlates accurately with this historical event. Interestingly, according to our estimation, Mongolians received their European ancestry 32.9 ± 0.9 generations, or 954 years ago. This is
around the time of the expansion of Mongolians in military and politics in the 12th century, who in turn built the largest contiguous land empire in human history. However, we did not always
observe the extent of ALD with genetic distance due to the extremely low level of gene flow for some groups, such as CEU and CHS. Similar approaches were applied for both EUR and CSA. Two
populations from Great Britain (GBR and Orcadian) shared a similar recent admixture time with EAS (82.8 ± 39.6 and 78.1 ± 8.6 generations, respectively), which were older than other EUR.
Adygei received their EAS ancestry 24.1 ± 1.2 generations, or 699 years ago. The gene flow from EAS to Finnish and Russian populations could be dated back 64.2 ± 1.1 and 45.2 ± 1.3
generations, or 1,862 and 1,311 years, respectively. Our estimation of admixture between EAS and EUR in CSA populations was 26.4 ± 0.5 generations for Uygur, 24.4 ± 0.2 generations for
Hazara and 49.2 ± 1.1 and 51.2 ± 2.3 generations for Burusho and Pathan, respectively. The small fraction of EUR ancestry in Kalash was derived from 61.8 ± 5.3 generations ago. It's
70.7 ± 3.1 for Sindhi and 82 ± 4.1 for Balochi, respectively. However, we were aware of the complex demographic history of CSA and multiple waves of admixture may have occurred at different
times. Based on the decay of the extended ALD pattern, which is likely to be affected by bottlenecks and multiple or continuous gene flows, the estimation of _ROLLOFF_ tends to correspond
reasonably well with more recent admixture events12. ADMIXTURE IN THE UYGUR According to the historical records, ancestors of Uygur can be traced to ancient Chidi and Dingling populations
living in this region in the 3rd century B.C. The Silk Road crossed Xinjiang which improved the communication between EUR and EAS can be traced back to 206 B.C. Admixture is likely to have
taken place since then, or even earlier. However, our study and one previous study11 gave a very short estimation of about 26 generations (Table 2) since admixture based on approach that
assesses the decay of ALD which tends to reflect more recent events if multiple waves of admixture happened. We next explored possible scenarios with respect to multiple admixture of the
Uygur using simulation. We simulated two waves of admixture with the earlier one occurred around 110 generations ago and the later one occurred around 25 generations ago which represents a
recent admixture event. Admixture time based on HI model was estimated by two approaches, one was based on number of ancestral segments (equation (5)), while the other was based on assessing
the decay of ALD. According to the results of simulated data (Supplementary Fig. S4 and Supplementary Table S3), it was apparent that the second approach through assessing the decay of ALD
tended to capture information of the more recent admixture event and it was even more pronounced in those scenarios with higher weight of the second admixture. In empirical data, which
consists 42 Uygur samples genotyped by Affymetrix Genome-Wide Human SNP Array 6.0 (Affy6.0), we estimated admixture time by inferring recombination on Uygur chromosomes with HAPMIX21.
Expected admixture time was estimated to be 54 generations by the average number of segments (equation (5)), which is much larger than the estimation of 26 generations using ALD information
(Supplementary Table S3). This estimation could be an intermediate of ancient admixture and recent admixture. As such, our results indicated the admixture in Uygur is compatible with
multiple waves of admixture between EAS and EUR. A NORTHERN PATH OF EUR GENE FLOW DIFFUSING INTO EAS Apparently gene flow between EUR and EAS is highly correlated with geographical locations
of populations from West to East in the Eurasian continent, as revealed by our estimations (_r_2 = 0.74) (Fig. 3a). More interestingly, we observed a North-to-South decline of EUR gene flow
in all EAS populations (_r_2 = 0.71) (Fig. 3b), which suggested a northern route for EUR diffusion into EAS. Populations from the Northern part of East Asia were more likely to have genetic
communication with EUR, as Silk Road facilitated the communication of East and West world4,22 and nomadic populations in Northern Asia such as Mongolian were likely to contact with people
from Caucasus region or other European-like populations around them in history and intermediate the EUR gene flow into other EAS23. Our data reveal that populations in the North such as
Mongolian, Xibo, Oroqen, Hezhen, Northern Han Chinese and Tu inherited much more European ancestry than populations in the South, such as She, Tujia, Yi, Miao and Southern Han Chinese.
Exceptionally, Japanese and Korean populations did not receive as much gene flow from EUR (1.6% for Korean, 2.2% for Japanese) as other Northern EAS did, which is likely due to their
isolated location in Northeast Asia. DISCUSSION In this study, by analyzing genome-wide SNP data, we revealed that recent genetic admixture did occur and have been prevalent in Eurasia
continent, notably, gene flows have been detected even between northern European and East Asian populations which are geographically far away from each other and generally considered as
well-differentiated populations. We would like to point out that the EAS gene flow to EUR we observed in this study might not exactly came from EAS, instead, it could come from some
EAS-related people who no longer live in East Asia. Similar situation could be applied to EUR. Even though Dai and French were not necessarily the true ancestors who directly contribute
genetic materials to other Eurasians, using them as surrogates of ancestors would not have significantly affected the estimations of admixture. This could be observed in our simulation study
for estimating admixture proportion using sister groups instead of real ancestors and with consideration of ascertainment bias. We simulated ascertainment bias by using markers with minor
allele frequency (of all populations, EUR only and EAS only)>5% (Supplementary Fig. S5 and S6). The previous application of _ROLLOFF_ in time estimations has also been shown to be robust
using surrogates of real ancestors in previous study11. Our approach and simplified model in admixture estimations will still be robust when the admixture history is complicated, such as
multiple admixture event or pre-mixed ancestors. The estimation of admixture proportion would not be remarkable affected (simulations in Supplementary Fig. S7 and S8), while dating admixture
mainly reflects the recent admixture event (simulations in Supplementary Fig. S4 and S9,Supplementary Table S3). In addition, our results are consistent with some recent studies8,9, while
we identified and estimated EUR admixture in EAS which was not well described in previous studies. We found signals of gene flow in many populations with reasonable interpretations,
especially with respect to EUR admixture in EAS. Our estimation of admixture time was based on the assumption of an HI model, which is a simplified model for the complex untraceable
admixture reality. In realistic scenarios, most admixtures between populations could be continuous or multiple waved. The real parameters of admixture such as proportions and time are
usually incomprehensible. Even though some estimations here might be indecipherable to real history, we could estimate, by modeling admixture based on genetic diversity, LD and ancestral
segmental distribution, many useful parameters such as the effective admixture proportion and effective admixture time which are helpful to further evolutionary and medical studies. The
algorithm (_ROLLOFF_) we applied to date admixture in our study is LD-based, one tricky issue for such algorithm is that we could not precisely distinguish admixture LD from the background
LD, especially when the admixture level is extremely low. That's why _ROLLOFF_ lose power for dating admixture in some populations with low level of gene flow. Taken together, although
fine-scale dissection of the demographic history of human populations in Eurasia and precise estimation of evolutionary parameters need improved methods and data, our current study provided
an overall picture of subsequent genetic interaction among well-differentiated populations. Our results advanced our understanding of the history of human migration and the evolutionary
mechanisms that have shaped the genetic structure of populations in Eurasia. METHODS POPULATION SAMPLES AND DATA Samples of 1,256 individuals in total from 34 Eurasian populations, one
African population Yoruban (YRI) and one Oceanian population Papuan were obtained in this study. Genome-wide SNP data were acquired from both public datasets (1000 Genomes Project (1 KG)13,
the Human Genome Diversity Panel (HGDP)14) and other studies in which there are 100 Korean samples (South Korea), 46 Tibetans (Tibet15) and 44 Uygurs (Xinjiang, China1), genotyped by
Affy6.0. Details of samples were listed in Table 1.The combined data was further filtered to exclude individuals with>10% missing genotypes and SNPs with missing rate>10% as well as
those exhibiting Hardy-Weinberg disequilibrium (p <0.001). Pairwise kinship coefficients were estimated in each population24. According to the relationship inference criteria, individuals
in the first (e.g. full-sibs), second (e.g. half-sibs) and third (e.g. first cousins) degrees of relationship were removed from our study. At last, we obtained 1,132 Eurasian samples with
186,506 SNPs after integration and quality control. PRINCIPLE COMPONENT ANALYSIS Principle component analysis (PCA) was performed with EIGENSOFT16 version 5.0.1 based on 96,538 pruned SNPs,
which were randomly selected from 186,506 autosomal SNPs of all merged samples with interval distance larger than 10 kb to avoid high linkage disequilibrium. MODELING ADMIXTURE BETWEEN EUR
AND EAS We assumed that admixture events between EUR and EAS occurred following the HI model (Supplementary Fig. S1). Since ancestral populations predating admixture are unavailable, an
alternative is to determine proper surrogates of ancestral EUR and EAS. An approach was employed to select the least-admixed EAS and EUR exhibiting minimal gene flow. To choose proper
surrogates for ancestral EAS, we applied a set of f4-tests to the proposed relationship (_YRI_, (_EUR_, (_EAS__i_, _EAS__j_))) for each pair of EAS (EASi and EASj) under consideration. where
EURanc represents the ancestral populations of EUR, pi and pj is the EUR contribution to EASi and EASj, respectively, T is the quantity of drift depicted in Supplementary Fig. S1. Equation
(1), (2), (3) and (4) were derived according to the explanation of f statistics10,11. The expectation of f statistics is mathematically appropriate to the drift paths in the admixture graph.
A positive value means that EUR contribution to EASi is smaller than to EASj. We can therefore easily choose the least-admixed EAS as a surrogate of ancestral EAS. For EUR, we applied
similar f4-tests to the proposed relationship (_YRI_, ((_EUR__i_, _EUR__j_), _EAS_)) for each pair of EUR (EURi and EURj). where EASanc represents the ancestral populations of EAS, pi and pj
is the EURanc contribution to EURi and EURj, respectively and W is the quantity of drift depicted in Supplementary Fig. S1. A population consistently exhibiting positive values of the
f4-test was treated as the surrogate of the ancestral EUR. STATISTICAL ANALYSIS TO DETECT GENE FLOW BETWEEN EUR AND EAS We applied two model-based statistics (the f4-test and the
f3-test10,11) to detect gene flow between Eurasian populations. Weighted Block Jackknife25,26, which drops 5 centimorgan (cM) blocks10 of the genome in each run, was used to compute a
standard error of the statistic. We tested for admixture by assessing whether the statistic is more than 2 standard deviations from zero. For EAS, we assessed whether the statistics
_f_4(_YRI_, _EUR__anc_; _EAS__anc_, _EAS__i_), whose expected value should be proportional to _p__i_ × T, were significantly different from zero (Supplementary Fig. S1). A Z-score deviating
from zero (≥2) could be considered as evidence of gene flow from EUR. Similarly, we examined the value of _f_4(_YRI_, _EAS__anc_; _EUR__anc_, _EUR__i_) for EUR, which is expected to equal
the product of the EAS contributions and their shared drift (1 − _p__i_) × _W_ for any EUR (Supplementary Fig. S1). In this case, a Z-score ≥2 could be considered as evidence of gene flow
from EAS. In contrast to EAS and EUR, for each CSA (CSAi), we used two f4-tests, i.e. _f_4(_YRI_, _EUR__anc_; _EAS__anc_, _CSA__i_) and _f_4(_YRI_, _EAS__anc_; _EUR__anc_, _CSA__i_) and one
f3-test, i.e. _f_3(_CSA__i__, EUR__anc_, _EAS__anc_). Z-scores deviating from zero provided evidence of admixture. QUANTITATIVE ESTIMATION OF THE GENE FLOW BETWEEN EUR AND EAS We used two
different f4 based approaches, Regression Ancestry Estimation10 and F4 Ratio Estimation11,12, to estimate the extent of gene flow between EUR and EAS. REGRESSION ANCESTRY ESTIMATION We
investigated a linear regression model based on two sets of f4-test values. Taking EAS as an example, the expected value of _f_4(_YRI_, _EUR__anc_; _EAS__anc_, _EAS__i_) is proportional to
_p__i_ × T. We designed an additional f4-test, i.e._f_4(_YRI_, _Papuan; EUR__anc_, _EAS__i_) and the expected value is proportional to (1 − _p__i_) × _W,_ where W is a measurement of genetic
drift, as described in Supplementary Fig. S2. Notably, if all EAS were derived from the same admixture event, genetic drift as measured by T or W should be similar for all these groups. For
any pair of EAS, there should be: When we plotted values of _f_4(_YRI_, _EUR__anc_; _EAS__anc_, _EAS__i_) against values of _f_4(_YRI_, _Papuan_; _EUR__anc_, _EAS__i_), all groups should be
represented by a linear model with a negative slope. By carrying out a least-squares fit for all EAS groups, we extrapolated the x- and y-intercepts, which correspond to the f4 values
expected for groups with entire EUR and EAS ancestries, to estimate the drift as measured by T and W. We could in turn estimate the admixture proportion for each group. We implemented
Weighted Block Jackknife, where one chromosome was excluded each run and studied the fluctuation of the statistic over 22 runs. The statistics estimated each run were weighted by the SNP
count of the excluded chromosome. F4 RATIO ESTIMATION We assumed the population relationship (_YRI_, (_EUR__anc_, ((_EAS__i_, _EAS__anc_), _Papuan_))) depicted in Supplementary Fig. S2. Two
different f4-tests were used to directly estimate the proportion of admixture. The expected value of _f_4(_YRI_, _Papuan_; _EAS__i,_ _EAS__anc_) is proportional to _p__i_ × _W_ whereas the
expected value of _f_4(_YRI_, _Papuan_; _EUR__anc__, EAS__anc_) is proportional to the magnitude of drift W. The ratio of these two f4-tests is therefore expected to be pi: With the above
procedure, we could estimate the admixture proportions of EUR and EAS for each group. The quantity of this ratio was summed over all markers and standard error was calculated using Weighted
Block Jackknife in which we dropped a block of 5 cM each repeat. DATING ADMIXTURE To estimate the time of admixture events, we applied an ALD-based method implemented in _ROLLOFF_11,12,
which computes the time since admixture using the rate of exponential decline of ALD. _ROLLOFF_ computes the correlation between a pair of markers and a weight that reflects their allele
frequency differentiation in the ancestral populations. By examining the change in this correlation with increasing genetic distance among these markers and fitting an exponential
distribution to the decay of correlation by least-squares, we obtained an estimation of the date that gene flow occurred. _ROLLOFF_ was also used to compute an approximately normally
distributed standard error by carrying out Weighted Block Jackknife analysis, where one chromosome was excluded each run. By examining the fluctuation of the statistic, we could assess the
stability of the estimation. Ancestral origin of chromosomal segments is also informative for dating admixture. Since ancestral segments of chromosomes from mixed population could be
inferred by some algorithms such as HAPMIX21, expected admixture time (T) could be estimated with equation Where S is the number of segments with one allele from ancestry A and the other
allele from ancestry B (as shown in Supplementary Fig. S10), PA is contribution from ancestry A, L is chromosome length in Morgons and T is time in generations since admixture. SIMULATIONS
Both backward time and forward time simulations were conducted in this study for different purposes. To evaluate the potential influence on our results of ascertainment bias, using
surrogates instead of real ancestries and pre-mixed ancestries in the estimations of admixture, we performed coalescent simulations implemented in _ms_27. We used the similar parameters of
demographic history as those in a previous study11. Simulation study of each scenario was repeated one hundred times. Command lines were listed in Supplementary Fig. S5 and Supplementary
Fig. S7. The influence of ascertainment bias was evaluated using SNPs from three different ascertains, which are based on minor allele frequency (MAF) of all simulated populations, EUR only
and EAS only. We compared the estimations using all alleles and common alleles only (MAF>5%). Forward time simulations were conducted to generate Eurasian admixed (Uygur-like) haplotypes
with ancestries from ancestral surrogates (e.g. CEU and CHB), with genotype data downloaded from HapMap 328 and phased by Beagle v3.3.229. Ancestral segments with recombination breakpoints
information in Uygur genomes were recorded during simulations. Simulated admixture scenarios were listed in Supplementary Table S3. Forward time simulations were also conducted to evaluate
the influence of pre-mixed ancestries on estimation of admixture time (Supplementary Fig. S9). REFERENCES * Xu, S., Huang, W., Qian, J. & Jin, L. Analysis of genomic admixture in Uyghur
and its implication in mapping strategy. Am. J. Hum. Genet. 84, 883–894 (2008). Article Google Scholar * Xu, S. & Jin, L. A genome-wide analysis of admixture in Uyghurs and a
high-density admixture map for disease-gene discovery. Am. J. Hum. Genet. 83, 322–336 (2008). Article CAS Google Scholar * Xu, S., Jin, W. & Jin, L. Haplotype-sharing analysis showing
uyghurs are unlikely genetic donors. Mol. Biol. Evol. 26, 2197–2206 (2008). Article Google Scholar * Comas, D. et al. Trading genes along the silk road: mtDNA sequences and the origin of
central Asian populations. Am. J. Hum. Genet. 63, 1824–38 (1998). Article CAS Google Scholar * Lai, S. P. et al. [HLA-DRB alleles polymorphism in Han, Hui, Uygur and Tibetan populations
in northwestern China]. Yi Chuan Xue Bao 26, 447–57 (1999). CAS PubMed Google Scholar * Su, B. et al. Y-Chromosome evidence for a northward migration of modern humans into Eastern Asia
during the last Ice Age. Am. J. Hum. Genet. 65, 1718–24 (1999). Article CAS Google Scholar * Yao, Y.-G., Kong, Q.-P., Wang, C.-Y., Zhu, C.-L. & Zhang, Y.-P. Different matrilineal
contributions to genetic structure of ethnic groups in the silk road region in china. Mol. Biol. Evol. 21, 2265–80 (2004). Article CAS Google Scholar * Hellenthal, G. et al. A genetic
atlas of human admixture history. Science 343, 747–751 (2014). Article CAS ADS Google Scholar * Lipson, M. et al. Efficient moment-based inference of admixture parameters and sources of
gene flow. Mol. Biol. Evol. 30, 1788–802 (2013). Article CAS Google Scholar * Reich, D., Thangaraj, K., Patterson, N., Price, A. L. & Singh, L. Reconstructing Indian population
history. Nature 461, 489–494 (2009). Article CAS ADS Google Scholar * Patterson, N. et al. Ancient admixture in human history. Genetics 192, 1065–93 (2012). Article Google Scholar *
Moorjani, P., Patterson, N. & Hirschhorn, J. The history of African gene flow into Southern Europeans, Levantines and Jews. PLoS Genet. 7, e1001373, 10.1371/journal.pgen.1001373. (2011).
Article CAS PubMed PubMed Central Google Scholar * Abecasis, G. R. et al. A map of human genome variation from population-scale sequencing. Nature 467, 1061–73 (2010). Article ADS
Google Scholar * Li, J. Z. et al. Worldwide human relationships inferred from genome-wide patterns of variation. Science 319, 1100–4 (2008). Article CAS ADS Google Scholar * Xu, S. et
al. A genome-wide search for signals of high-altitude adaptation in tibetans research article. 28, 1003–1011 (2011). * Patterson, N., Price, A. L. & Reich, D. Population structure and
eigenanalysis. PLoS Genet. 2, e190, 10.1371/journal.pgen.0020190 (2006). Article CAS PubMed PubMed Central Google Scholar * Auton, A. et al. Global distribution of genomic diversity
underscores rich complex history of continental human populations. Genome Res. 19, 795–803 (2009). Article CAS Google Scholar * Richards, M. et al. Extensive female-mediated gene flow
from sub-Saharan Africa into near eastern Arab populations. Am. J. Hum. Genet. 72, 1058–64 (2003). Article CAS Google Scholar * Fenner, J. N. Cross-cultural estimation of the human
generation interval for use in genetics-based population divergence studies. Am. J. Phys. Anthropol. 128, 415–23 (2005). Article Google Scholar * Tanaka, M. & Cabrera, V. Mitochondrial
genome variation in eastern Asia and the peopling of Japan. Genome Res. 14, 1832–50 (2004). Article CAS Google Scholar * Price, A. L. et al. Sensitive detection of chromosomal segments
of distinct ancestry in admixed populations. PLoS Genet. 5, e1000519, 10.1371/journal.pgen.1000519 (2009). Article CAS PubMed PubMed Central Google Scholar * Beckwith, C. I. Empires of
the silk road: a history of central eurasia from the bronze age to the presen. (Princeton University Press., 2006). * Atwood, C. P. Encyclopedia of mongolia and the mongol empire. (Facts on
File, Inc, 2004). * Manichaikul, A. et al. Robust relationship inference in genome-wide association studies. Bioinformatics 26, 2867–73 (2010). Article CAS Google Scholar * Busing, F.,
Meijer, E. & Van Der Leeden, R. Delete-m jackknife for unequal m. Stat. 9, _Comput._ 3–8 (1999). Google Scholar * Kunsch, H. The jackknife and the bootstrap for general stationary
observations. Ann. Stat. 17, 1217–1241 (1989). Article MathSciNet Google Scholar * Hudson, R. R. Generating samples under a Wright-Fisher neutral model of genetic variation.
Bioinformatics 18, 337–338 (2002). Article CAS Google Scholar * Altshuler, D. M. et al. Integrating common and rare genetic variation in diverse human populations. Nature 467, 52–8
(2010). Article CAS ADS Google Scholar * Browning, S. R. & Browning, B. L. Rapid and accurate haplotype phasing and missing-data inference for whole-genome association studies by use
of localized haplotype clustering. Am. J. Hum. Genet. 81, 1084–97 (2007). Article CAS Google Scholar Download references ACKNOWLEDGEMENTS We thank LetPub and Science Craft for their
linguistic assistance during the preparation of this manuscript and Dr. Wenfei Jin for his discussion on the data analysis. These studies were supported by the Strategic Priority Research
Program of the Chinese Academy of Sciences (CAS) (XDB13040100), by the National Science Foundation of China (NSFC) grants (91331204, 31171218). S.X. is Max-Planck Independent Research Group
Leader and member of CAS Youth Innovation Promotion Association. S.X. also gratefully acknowledges the support of the National Program for Top-notch Young Innovative Talents of The
"_Wanren Jihua_" Project. AUTHOR INFORMATION AUTHORS AND AFFILIATIONS * Chinese Academy of Sciences (CAS) Key Laboratory of Computational Biology, Max-Planck Independent Research
Group on Population Genomics, CAS-MPG Partner Institute for Computational Biology, Shanghai Institutes for Biological Sciences, Chinese Academy of Sciences, Shanghai, 200031, China Pengfei
Qin, Ying Zhou, Haiyi Lou, Dongsheng Lu, Xiong Yang, Yuchen Wang & Shuhua Xu * Ministry of Education (MOE) Key Laboratory of Contemporary Anthropology, School of Life Sciences and
Institutes of Biomedical Sciences, Fudan University, Shanghai, 200433, China Li Jin * Integrated Research Center for Genome Polymorphism, Department of Microbiology, The Catholic University
Medical College, Socho-gu Seoul, 137-701, Korea Yeun-Jun Chung * School of Life Science and Technology, ShanghaiTec University, Shanghai, 200031, China Shuhua Xu * Collaborative Innovation
Center of Genetics and Development, Shanghai, 200438, China Shuhua Xu Authors * Pengfei Qin View author publications You can also search for this author inPubMed Google Scholar * Ying Zhou
View author publications You can also search for this author inPubMed Google Scholar * Haiyi Lou View author publications You can also search for this author inPubMed Google Scholar *
Dongsheng Lu View author publications You can also search for this author inPubMed Google Scholar * Xiong Yang View author publications You can also search for this author inPubMed Google
Scholar * Yuchen Wang View author publications You can also search for this author inPubMed Google Scholar * Li Jin View author publications You can also search for this author inPubMed
Google Scholar * Yeun-Jun Chung View author publications You can also search for this author inPubMed Google Scholar * Shuhua Xu View author publications You can also search for this author
inPubMed Google Scholar CONTRIBUTIONS S.X. conceived and designed the study. L.J. and Y.C. contributed to population samples and genotyping data. P.Q. performed data analysis, with
contribution from Y.Z., H.L., D.L., X.Y. and Y.W. S.X. and P.Q. wrote the paper. ETHICS DECLARATIONS COMPETING INTERESTS The authors declare no competing financial interests. ELECTRONIC
SUPPLEMENTARY MATERIAL SUPPLEMENTARY INFORMATION Supplementary information RIGHTS AND PERMISSIONS This work is licensed under a Creative Commons Attribution 4.0 International License. The
images or other third party material in this article are included in the article's Creative Commons license, unless indicated otherwise in the credit line; if the material is not
included under the Creative Commons license, users will need to obtain permission from the license holder in order to reproduce the material. To view a copy of this license, visit
http://creativecommons.org/licenses/by/4.0/ Reprints and permissions ABOUT THIS ARTICLE CITE THIS ARTICLE Qin, P., Zhou, Y., Lou, H. _et al._ Quantitating and Dating Recent Gene Flow between
European and East Asian Populations. _Sci Rep_ 5, 9500 (2015). https://doi.org/10.1038/srep09500 Download citation * Received: 14 September 2014 * Accepted: 09 March 2015 * Published: 02
April 2015 * DOI: https://doi.org/10.1038/srep09500 SHARE THIS ARTICLE Anyone you share the following link with will be able to read this content: Get shareable link Sorry, a shareable link
is not currently available for this article. Copy to clipboard Provided by the Springer Nature SharedIt content-sharing initiative
Trending News
Fofana left chelsea staff red-faced after funny cobham incidentBut he has now started in the last two games, even with a switch in formation. With Thiago Silva recently having turned ...
You need to have a package of talents to be able to turn hobby into a business.You need to have a package of talents to be able to turn hobby into a business. A lot of people are creative but they la...
Rafael nadal coach reveals ‘nervous’ issues ahead of djokovic finalThat’s the view of Nadal’s coach Carlos Moya, with Nadal looking to win just his second title in Melbourne. Nadal comes ...
Narcos mexico season 2 location: where is narcos mexico filmed?Netflix series Narcos Mexico season two landed on February 13 with 10 more episodes. The drama is based on real-life eve...
Quantitating and dating recent gene flow between european and east asian populationsABSTRACT Historical records indicate that extensive cultural, commercial and technological interaction occurred between ...
Latests News
Quantitating and dating recent gene flow between european and east asian populationsABSTRACT Historical records indicate that extensive cultural, commercial and technological interaction occurred between ...
Narcos mexico season 2 location: where is narcos mexico filmed?Netflix series Narcos Mexico season two landed on February 13 with 10 more episodes. The drama is based on real-life eve...
Rafael nadal coach reveals ‘nervous’ issues ahead of djokovic finalThat’s the view of Nadal’s coach Carlos Moya, with Nadal looking to win just his second title in Melbourne. Nadal comes ...
You need to have a package of talents to be able to turn hobby into a business.You need to have a package of talents to be able to turn hobby into a business. A lot of people are creative but they la...
Fofana left chelsea staff red-faced after funny cobham incidentBut he has now started in the last two games, even with a switch in formation. With Thiago Silva recently having turned ...