Investigating the effect of parameters in the thermodynamic analysis of the solid oxide fuel cell cycle using response surface methodology
Investigating the effect of parameters in the thermodynamic analysis of the solid oxide fuel cell cycle using response surface methodology"
- Select a language for the TTS:
- UK English Female
- UK English Male
- US English Female
- US English Male
- Australian Female
- Australian Male
- Language selected: (auto detect) - EN
Play all audios:
ABSTRACT In this article, the effect of parameters in the solid oxide fuel cell cycle has investigated using the response surface method. The thermodynamic modeling of this cycle has been
done by EES software, which by considering three variables (current density, molar flow rate and fuel cell temperature) as input parameters, to examine the mutual effects of parameters on
the objective functions (net output power and exergy efficiency) using the experimental design method. According to the results of thermodynamic analysis, the net power output and exergy
efficiency of solid oxide fuel cell are 2424 kW, 52.29% and 50.43%, respectively. By transferring the tests based on the central composite design for the parameters obtained by the Design
Expert software, the extracted results show the interaction effect of the input parameters. According to the results of the regression analysis, the values of R2 in the responses of net
output power and exergy efficiency are 96% and 87.79%, respectively, which shows the accuracy of the model. The parameters have a good interaction effect with each other and the optimal
points for the input parameters of current density (i), input methane molar flow rate (nCH4) and solid oxide fuel cell temperature (TSOFC) has been calculated at the points of 2311.53 A/m2,
0.0068 kmol/s and 1200 K, as well as the responses of net output power and exergy efficiency at points 3555.18 kW and 0.68345%. SIMILAR CONTENT BEING VIEWED BY OTHERS OPTIMIZATION FOR
MAXIMUM SPECIFIC ENERGY DENSITY OF A LITHIUM-ION BATTERY USING PROGRESSIVE QUADRATIC RESPONSE SURFACE METHOD AND DESIGN OF EXPERIMENTS Article Open access 24 September 2020 MODELING AND
OPTIMIZATION OF CO2 MASS TRANSFER FLUX INTO PZ-KOH-CO2 SYSTEM USING RSM AND ANN Article Open access 10 March 2023 4-E ANALYSIS AND MULTIPLE OBJECTIVE OPTIMIZATIONS OF A NOVEL SOLAR-POWERED
COGENERATION ENERGY SYSTEM FOR THE SIMULTANEOUS PRODUCTION OF ELECTRICAL POWER AND HEATING Article Open access 14 December 2023 INTRODUCTION According to the growing need of humans for
renewable energy and reducing pollution, the importance of renewable systems is increasing day by day. Therefore, approaches and technologies have been developed to improve energy conversion
efficiency and reduce greenhouse gas emissions. Fuel cells have provided an efficient method compared to conventional electricity generation methods to produce energy resulting from the
direct conversion of fuel chemical energy into thermal energy and electricity1. Solid oxide fuel cell is a new technology to produce electric energy with high efficiency through direct
mixing of fuel and oxidation without any environmental and noise pollution. High operating temperature (600–1000 °C), variety of fuel, resistance to sulfur, insensitivity to carbon monoxide
and having high potential in simultaneous production are the advantages of solid oxide fuel cells2. The fuel used in the solid oxide fuel cell can be natural gas, carbon monoxide, methanol,
ethanol, hydrocarbon compounds and also hydrogen. Solid oxide-fuel cells can be used in power generation systems, stationary power generators, as well as auxiliary power sources for cars,
airplanes, or even in residential applications. A cell consists of interconnected structures and a three-layer region consisting of two ceramic electrodes (anode and cathode) separated by a
ceramic electrolyte. The oxygen ions formed in the cathode are transferred to the anode/electrolyte interface through the ion-conducting electrolyte, where they react with the fuel gases and
produce water, and at the same time release electrons. which flow through an external circuit to the cathode/electrolyte interface. Unlike low temperature polymer fuel cells, solid oxide
fuel cells operate at high enough temperatures that allow direct reforming of natural gas. Flexibility in fuel consumption is one of the advantages of solid oxide fuel cell compared to other
fuel cells. Hydrocarbon fuels can be supplied directly without the need for pre-reforming process3. Some examples of the researches that have been carried out using the solid oxide fuel
cell cycle have been briefly mentioned. Ranjbar et al.4 used a solid oxide fuel cell cycle as the driver of a triple production system and evaluated the combined system from the perspective
of energy and exergy. According to the obtained results, energy and exergy efficiency decreased with increasing current density because the voltage of solid oxide fuel cell decreased with
increasing current density and the triple generation system produced less power at high current density. Energy efficiency and exergy efficiency are 79% and 47%, respectively. Akkaya and
Sahin5 studied a hybrid system consisting of a solid oxide fuel cell and an organic Rankine cycle. The results of analyzes show that by recovering the waste heat of the solid oxide fuel cell
through the organic Rankine cycle based on the design parameter conditions, the efficiency increases by about 14 to 25%. Baniasadi et al.6 developed an integrated system including heat and
electricity production for automotive applications, in which the main component of electricity production is a solid oxide fuel cell that uses ammonia as fuel. Their research has shown that
increasing the output power of fuel cells from 35 to 70 kW has increased the exergy efficiency of combined cycles by 50% and reduced the energy efficiency by 10%. When the average operating
temperature is increased by 100 °C, the entropy production rate of the system has decreased by about 25%. Roushenas et al.7 presented a new integrated system based on solid oxide-fuel cell
with compressed air energy storage. According to the results, the energy and exergy efficiency are 78% and 58%, respectively. Ryu et al.8 have analyzed the thermodynamic performance of a
combined fuel cell-solid oxide-gas turbine system for marine ships using ammonia and hydrogen fuels. The performance of the proposed system has been investigated using the first and second
laws of thermodynamics and the energy efficiency for the solid oxide fuel cell using ammonia and hydrogen fuels has been obtained as 60.96% and 64.46%, respectively. Compared to independent
SOFC, the energy efficiency of the combined system for ammonia and hydrogen fuels has increased by 12.37% and 13.97%, respectively. It is also found from the parametric analysis of the
system that ammonia has potential as a hydrogen carrier and waste heat recovery is an effective method to improve the thermodynamic performance of the system. Soleymani et al.9 analyzed the
energy, exergy and thermoeconomics of the new solid oxide fuel cell and biogas steam reforming system. The results showed that the energy and exergy efficiency for the combined system
compared to the basic cycle of fuel cell-solid oxide was obtained as 23.31% and 28.19%, respectively. Also, from the point of view of exergy, it has been observed that the afterburner
accounts for the largest amount of exergy destruction, about 26% of the total exergy destruction. Chitgar et al.10 proposed an integrated system including solid oxide fuel cell, gas turbine,
Kalyan cycle, organic Rankine cycle and liquefied natural gas steam for endothermic plate to produce electricity, fresh water and hydrogen. At the optimal point, the exergy efficiency of
the system is 54.2% and the total unit cost of the products is calculated as 34.5 $/GJ. The energy and exergy efficiency of the combined system is 64.3% and 49%, respectively, which shows an
improvement of about 13% compared to the independent solid oxide fuel cell system. Ghaebi et al.11 studied the thermodynamic analysis of the basic cycle of solid oxide fuel cell and
humidifier-dehumidifier desalination. According to the calculated results, energy and exergy efficiency for the whole system are 81.87% and 55.26%, respectively. It has also been determined
that the increase in pressure and the use of gas turbines in fuel cells have increased the energy efficiency and exergy of the system. Response surface methodology (RSM)12 is a set of
mathematical methods that determine the relationship between one or more response variables with several independent variables. This method was introduced in 1951 by Box and Wilson13, and it
is still used as one of the experimental design tools. In the process of optimization and identifying the optimal product from ongoing production batches, an experimental design known as
the Central Composite Design (CCD) has emerged. The Central Composite Design model is a key component of response surface methodology. One of the main advantages of this optimization model
is its higher accuracy, eliminating the need for a three-level factorial experiment when constructing a second-order quadratic model. After implementing the Central Composite Design model in
the experiment, a linear regression model is used to build the model, and combined values are applied. The Central Composite Design model is also referred to as the Box-Wilson Central
Composite Design14. Studies such as Kerami et al.15 have shown that the response surface method is an acceptable method compared to traditional modeling methods. In response surface designs,
the goal is to optimize the response (output variable) that is affected by several independent variables (input variables). Basically, the response surface methodology includes the
following steps: (a) two-factor tests to screen for effective input variables; (b) regression analysis to estimate the fitting function of outputs in terms of inputs, and (c) optimization in
order to determine the optimal levels of input variables. An important aspect of Response surface methodology is the design of experiments, commonly known as DOE. Experiment design method
is a useful approach to minimize time, cost and number of experiments. Design of experiments methods are used to optimize response variables in the presence of different factors with
different levels. Design of experiments is the use of geometric principles in statistical sampling to obtain the desired results. Achieving the desired answer with the least number of tests
is the most important goal in design of experiments15,16,17. Response surface method is one of the useful tools used in many engineering applications. As an example, Roy et al.18 optimized
the performance of an integrated system based on solid oxide fuel cell and gas turbine using the response surface method. According to the results, the regression models obtained from the
variance analysis tool have high accuracy for exergy efficiency, balanced cost of energy and exergy, which in optimal conditions, for the cogeneration system is 46.58%, 0.454 $/kw.h and
0.657 $/kwh has been obtained, respectively. Fei et al.19 presented a multiple power, fresh water and hot air production system based on solid oxide fuel cell, which used the response
surface method to optimize the system. Also, using variance analysis, the effect of parameters has been identified. According to the obtained results, the optimal points for fuel
consumption, current density and pressure ratio were obtained as 0.77, 0.9697 A/m2 and 3 respectively. In this research, a comprehensive investigation of the energy and exergy of the solid
oxide fuel cell system has been conducted using the response surface method. Therefore, the interaction of the parameters is also investigated and the accuracy of the system is statistically
analyzed. Regression models using response surface methodology are presented to estimate the output parameters and the effect of the considered parameters and their interaction on the
output parameters are investigated. Using RSM method (Central composite design) to examine the effectiveness of main parameters (current density (i), input molar flow rate of methane (nCH4)
and solid oxide fuel cell temperature (TSOFC)) on the performance of the system ( net output power and exergy efficiency) and examining their reaction on each other, also system optimization
are the main novelties of this paper, which distinguishes it from other researches that shows the difference between this study and the previous study. The motivation and purpose of this
research are: * • Analysis of the presented system using the first and second laws of thermodynamics. * • Examining the effect of input parameters on each other and on output parameters
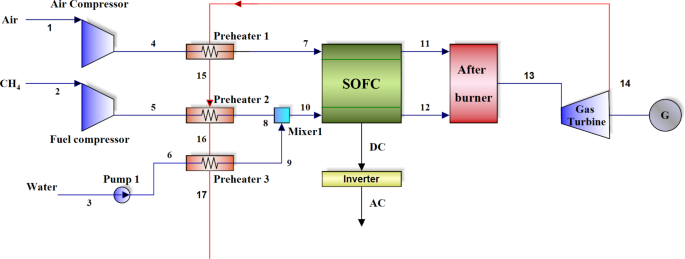
through the response surface method. * • Optimizing the proposed system by considering power output and exergy efficiency using Response Surface Methodology. SYSTEM DESCRIPTION As can be
seen in the solid oxide fuel cell system in Fig. 1., the fuel on one side and the air on the other side are compressed in the respective compressors (stream 1 and 2) and then they are
preheated with the heat output from the gas turbine (stream 4 and 5). On the other hand, the water coming out of the pump (stream 3) is preheated (stream 6) and mixed with the preheated fuel
(stream 8) to produce superheat steam with the heat output from the gas turbine by the relevant preheater (stream 10), to produce the required mixture for the internal reforming reaction.
The preheated air is directed to the fuel cell cathode section and the mixtured flow to the anode section. Electrochemical reaction occurs to produce non-alternating current, which is
converted into alternating current by the inverter. After the completion of the electrochemical reaction, the excess air coming out of the cathode (stream 11) is combusted with the unreacted
fuel coming out of the anode (stream 12) in the afterburner to produce combustible gas at high temperature and pressure, which is expanded to generate power by the gas turbine. The turbine
exhaust gas is used to preheat air, fuel and water respectively. SYSTEM MODELING ASSUMPTIONS AND SYSTEM INPUT INFORMATION In this section, the assumptions and equations considered to
simplify and analyze the system are: * All modeling has been done in stable conditions. * The air considered in the fuel cell contains 79% nitrogen and 21% oxygen. * Kinetic and potential
energy changes in all components of the system are ignored. * Heat losses in cycle components are ignored. * The temperature of the flow at the entrance of the fuel and air channel in the
fuel cell is considered constant and similar. * The pressure drop in all components is ignored. * The pressure of cathode and anode of the fuel cell is assumed to be constant and similar.
Also, for system analysis, a series of required input data is presented in Table 1. In addition, in this article, using Design Expert software, a series of experiments have been designed as
described in Tables 2 and 3, which are tested at three different levels (flow density (i), input methane mass flow rate (nCH4) and Solid oxide fuel cell temperature (TSOFC)). SOLID OXIDE
FUEL CELL MODELING Solid oxide fuel cell is an electrochemical device that directly converts chemical energy into electricity. In this research, the methane product is considered to feed the
fuel cell chamber. Electrochemical reactions as well as the general reaction in Cathode and anode occur, it is defined as follows: Reforming reaction:
$$\:C{H}_{4}+{H}_{2}O\to\:CO+3{H}_{2}$$ (1) Shifting reaction: $$\:CO+{H}_{2}O\to\:C{O}_{2}+{H}_{2}$$ (2) Overall reaction: $$\:{H}_{2}+0.5{O}_{2}\to\:{H}_{2}O$$ (3) In the shifting
reaction, the equilibrium constant is obtained from the following equation: $$\:{K}_{P}=\frac{{P}_{c{o}_{2}}\times\:{P}_{{H}_{2}}}{{P}_{co}\times\:{P}_{{H}_{2}}o}$$ (4)
$$\:log{K}_{P}=A{T}_{SOFC}^{4}+B{T}_{SOFC}^{3}+C{T}_{SOFC}^{2}+D{T}_{SOFC}+E$$ (5) where \(\:{P}_{{H}_{2O}}\), \(\:{P}_{CO}\), \(\:{P}_{{H}_{2}}\:\)and \(\:{P}_{CO2}\) represent the partial
pressures, \(\:{T}_{SOFC}\) represent the cell outlet temperature, and A, B, C, D and E are constant coefficients21. Assuming that the molar conversion rate for Eqs. (6–12) are
\(\:\dot{x}\), \(\:\dot{y}\) and \(\:\dot{z}\), respectively, their mass balance equations are defined as follows9:\(\:\dot{x}\) $$\:{\dot{n}}_{C{H}_{{4,in}}}=\dot{x}$$ (6)
$$\:{\dot{n}}_{{H}_{2}{O,in}}={2.5}\dot{x}$$ (7) $$\:{\dot{n}}_{{H}_{2}{,out}}={3}\dot{x}+\dot{y}-\dot{z}$$ (8) $$\:{\dot{n}}_{{CO,out}}=\dot{x}+\dot{y}$$ (9)
$$\:{\dot{n}}_{{CO_{2},out}}=\dot{y}$$ (10) $$\:{\dot{n}}_{{H}_{2}{O,out}}={2.5}\dot{x}-\dot{y}+\dot{z}$$ (11) $$\:{\dot{z}}=U_{f}({3}\dot{x}+\dot{y}$$ (12) which \(\:\dot{n}\) represents
the molar flow rate and \(\:{U}_{f}\) represents the fuel consumption factor. The output voltage of the fuel cell is obtained from the following Eq9: $$\:V_{SOFC}=V_{N}-V_{loss}$$ (13) MASS
AND ENERGY BALANCE Assuming stable conditions for each control volume shown in Fig. 1, the mass and energy balance for each system component are in the form of relations 14 and 15,
respectively20,22: $$\:\sum\:{\dot{\text{m}}}_{\text{i}\text{n}}=\sum\:{\dot{\text{m}}}_{\text{o}\text{u}\text{t}}$$ (14)
$$\:\sum\:{\dot{\text{E}}}_{\text{i}\text{n}}=\sum\:{\dot{\text{E}}}_{\text{o}\text{u}\text{t}}$$ (15) which \(\:{\dot{\text{E}}}_{\text{i}\text{n}}\) and
\(\:{\dot{\text{E}}}_{\text{o}\text{u}\text{t}}\) represents the amount of input energy and the amount of output energy to the control volume respectively. The total current and current
density are obtained from the following relations: $$\:{I}_{SOFC}={i.A}_{act}$$ (16) $$i= \frac{\dot{z}n_e{F}}{A_{act}}$$ (17) The power of the cell and the electric power of the fuel cell
are also determined from the following relationships: $$\:{\dot{W}}_{SOFC}\:=\:{I}_{SOFC}.{V}_{SOFC}$$ (18) $$\:{\dot{W}}_{SOFC,inv}\:=\:{\eta\:}_{inv}\:.{\dot{W}}_{SOFC}$$ (19) In this
order, the results of the whole system are defined as follows: net output power of the system:
$$\:{\dot{W}}_{net}\:=\:{\dot{W}}_{SOFC}+{\dot{W}}_{Tur}-\:{\dot{W}}_{Pum}-{\dot{W}}_{AC}-\:{\dot{W}}_{FC}$$ (20) Also, the energy efficiency and exergy efficiency of the system are
determined by the following relations: $$\:{\eta\:}_{en,SOFC}=\frac{{\dot{W}}_{net}}{{\dot{m}}_{fuel}\:.\:{LHV}_{fuel}}$$ (21)
$$\:{\eta\:}_{ex,SOFC}=\frac{{\dot{W}}_{net}}{{\dot{n}}_{2}\:.\:\:{\stackrel{-}{ex}\:}_{ch}^{{CH}_{4}}\:\:}$$ (22) DESIGN OF EXPERIMENTS Experimental design is the observation and
interpretation of variables on the output of the process, by making changes among the factors affecting the process, with the aim of improving the performance of a process. The response
surface method is a comprehensive set of mathematical and statistical techniques that are precisely designed to analyze different problems. This method includes a wide range of mathematical
and statistical tools that are used to build experimental models and extract valuable insights23. The objective of the response surface methodology is to establish the relationship between
the response variable and the levels of multiple input variables or factors that influence it using appropriate experimental design and analysis. One of the valuable aspects of response
surface methodology is to create a suitable approximate model between response and independent variables using analysis of variance (ANOVA)24. The most common model used to create the
function is the quadratic polynomial model called the regression model, which can be expressed as Eq. 2325:
$$\:Y={\beta\:}_{0}+\sum_{i=1}^{n}{\beta\:}_{i}{X}_{i}+\sum_{i=1}^{n}{\beta\:}_{ii}{X}_{i}^{2}+\sum_{i=1}^{n-1}\sum_{j=i+1}^{n}{\beta\:}_{ij}{X}_{i}{X}_{j}+\epsilon$$ (23) Analysis of
variance is used to check the accuracy of the model. Acceptance or rejection of the model conditions is set by considering the 95% confidence level on the probability value (p-values) and
the 5% significance level. Also, the coefficient of determination (R2) is an important parameter for analyzing and evaluating the model, which expresses the percentage of changes of 1 as
100% when the model can be described, which shows that the model has a good fit in the polynomial model with it has experimental data and 0 also shows the inability to describe the whole
model. Three-dimensional (3D) response surface diagrams have been used to visualize the interaction of independent variables with the response. In these graphs, while other variables were
kept at zero level, it is associated with the change of two variables. Also, the experimental values of the measurement response and the predicted values obtained from the model will be
evaluated. The coefficients of the equations and the analysis of variance test were calculated and the corresponding response level graphs were drawn based on this26. DISCUSSION AND RESULTS
Based on the design conditions, assumptions and governing equations of the energy and exergy analysis of the proposed system, the results of these analyzes and response surface methodology
analysis are given in this section. Also, the results of the validation are presented in reference25, and the obtained results are in good agreement with previous studies. THERMODYNAMIC
ANALYSIS RESULTS The results of the thermodynamic analysis of the system are given in Table 4. As can be seen, the energy efficiency and exergy efficiency of the system are 52.29% and
50.43%, respectively. REGRESSION RESULTS In order to determine the accuracy of the model and the better fit of the proposed system, Quadratic model has been used for analysis and analysis of
variance (ANOVA) of the system. Testing has been done at three different levels for three input parameters of current density (i), input methane mass flow rate (nCH4) and solid oxide fuel
cell temperature (TSOFC), as well as two output parameters of net output power and exergy efficiency. According to the results obtained from the analysis of variance, the regression models
for the considered responses have been obtained in the form of Eqs. (24) and (25), respectively. Pvalue less than 0.05 indicates that the model is significant at the 95% confidence level. In
addition, according to Table 5, the values of R2 in the responses of net output power and exergy efficiency are 96% and 79.87%, respectively. Also, the values of R2adj for the
regression model of net output power and exergy efficiency are 92.40% and 81.76%, respectively, which indicates that this amount of variation in responses can be described by the considered
model.
$$\:\text{N}\text{e}\text{t}\:\text{o}\text{u}\text{t}\text{p}\text{u}\text{t}\:\text{p}\text{o}\text{w}\text{e}\text{r}=\hspace{0.17em}2291.89\--234.8\:\text{A}\:\:+\:606.5\:\text{B}\:-163.29\:\text{C}-122.49\:\text{A}\text{B}\:\--\:45\:\text{A}\text{C}\:-\hspace{0.17em}124.24\:\text{B}\text{C}\:-\hspace{0.17em}225.72\:\text{A}^2\hspace{0.17em}+\hspace{0.17em}138.77\:\text{B}^2\hspace{0.17em}+122.77\:\text{C}^2\:$$
(24)
$$\:\text{E}\text{x}\text{e}\text{r}\text{g}\text{y}\:\text{e}\text{f}\text{f}\text{i}\text{c}\text{i}\text{e}\text{n}\text{c}\text{y}\:=\:0.65\:-\:0.013\:\text{A}\:-\:9.44\:\text{B}\:-9.2\:\text{C}\:-\:6.05\:\text{A}\text{B}\:-\:2.57\text{A}\text{C}\:-\:6.6\:\text{B}\text{C}\:-\:0.013\:\text{A}^2\:+\:8.7\:\text{B}^2\:+\:7.236\:\text{C}^2$$
(25) EVALUATION OF MODELS In this section, to investigate the effect of input variables of flow density (i), input methane mass flow rate (nCH4) and solid oxide fuel cell temperature
(TSOFC), the statistical diagrams of turbulence and normal residuals have been used. As seen in Fig. 2, the disturbance diagrams show the effect of each factor’s deviation from the reference
point in the response process when other factors were assumed to be constant. According to Fig. 2 in diagram A, which is net power output, parameter A is a decreasing coefficient, parameter
B is an increasing coefficient, and parameter C is a decreasing coefficient with a small slope. Also, in diagram B related to the output of exergy efficiency, parameter A is a reduction
factor, parameter B and parameter C are a reduction factor that increases from one range to the next. The reasons for increase and decrease of the parameters will be examined in the next
section. Also, as seen in Fig. 3, the normal probability diagram shows how the residuals follow a normal distribution. Even with normal data some moderate distributions are expected. In both
answers, the smaller residual values indicate the accuracy of the model. EXAMINING THE EFFECTS OF VARIABLES According to Fig. 4, the effect of two parameters can be seen simultaneously on
the objective functions. As shown in Fig. 4-a, the effect of current density parameters (i) and input methane mass flow rate (nCH4) on the net output power response has been investigated,
which can be seen in both high current density and Bottom, net power output increased with increasing methane molar flow rate. Also, in the upper and lower range of methane molar flow rate,
with the increase in flow density, the amount of net power output increased a little and then started to decrease with different slopes, which the difference in slopes in the upper and lower
range represents the interaction of variables ( the flow density (i) and the mass flow rate of the input methane (nCH4)). An increase in the current density causes a decrease in the fuel
cell voltage, which is the reason for the increase in the voltage drop. According to relations25, the fuel cell voltage is obtained from the difference between the Nernest voltage and the
voltage loss. As the current density increases, the Nernst voltage increases, and on the other hand, a further increase is observed in the voltage loss (including activation voltage drop,
ohmic and concentration). According to the voltage drop relationships, due to having a direct relationship between the activation and ohmic voltage drop with the current density, we see an
increase in this variable. The concentration voltage drop also increases to a small amount, which in total causes an increase in the voltag loss and a decrease in the fuel cell voltage. As a
result, the net output power reaches the peak point with increasing current density and then decreases. The molar flow rate of methane is also directly related to the flow density and thus
the net output power increases. As the molar flow rate of fuel increases, both the amounts of fuel and water consumed rise, which in turn boosts the values of ẋ (moles of methane consumed in
the reforming reaction), ẏ (moles of carbon monoxide consumed in the shifting reaction), and ż (moles of hydrogen consumed in the electrochemical reaction of the SOFC). According to Eq. 17,
an increase in ż leads to a rise in current density. As observed, higher current density results in greater voltage loss, causing a reduction in cell voltage. However, the total current
also increases, with less impact on the cell voltage. Consequently, these changes lead to an increase in SOFC power. The net power generation capacity grows with the fuel flow rate due to
the higher SOFC voltage. Based on the relationship between voltage and power, the cell’s power is directly proportional to the current, which increases as the fuel flow rate rises, thus
boosting both the power and the net output of the cell. Additionally, an increase in fuel flow rate reduces the temperature and enthalpy at both the turbine inlet and outlet, which
influences turbine power and may alter the net power output. On the other hand, as the fuel flow rate increases, the SOFC voltage decreases because of the higher voltage losses. The energy
and exergy efficiencies of both the cell and the overall system are directly linked to the net power, meaning that both energy and exergy efficiencies improve with the higher fuel flow rate.
Figure 4b. shows the effect of current density parameters (i) and solid oxide fuel cell temperature (TSOFC), which changes in current density were investigated in the previous state. With
the increase in fuel cell temperature, the ohmic voltage drop has decreased, the concentration voltage drop and the activation voltage drop have increased, and this causes an increase in the
voltage loss. On the other hand, the Nernest voltage decreases with the increase of the fuel cell input temperature. As a result of these changes, with the increase of the cell input
temperature, the fuel cell power and then the net output power decreases and then increases with a gentle slope. Figure 4c. shows the effects of methane molar flow rate (nCH4) and solid
oxide fuel cell temperature (TSOFC), the changes of both variables were investigated in the previous states. Based on the slope of each variable in the upper and lower range, it can be said
that these two parameters have a good interaction with each other. Figure 5 shows the effect of variables such as flow density (i), input molar flow rate of methane (nCH4) and solid oxide
fuel cell temperature (TSOFC) on exergy efficiency. According to Fig. 5a., with the increase of current density, in high and low molar flow rates, the exergy efficiency increased and then
decreased with a gentle slope. The power of the cell has a direct relationship with the current density, which is also proportional to the net power and exergy efficiency, and these changes
have been examined in the previous cases. Increasing the molar flow rate increases net power, but on the other hand, it has an indirect relationship with exergy efficiency according to Eq.
25. As a result, with the increase of the molar flow rate, the exergy efficiency first decreases and then increases. Figure 5b. shows the effect of current density (i) and solid oxide fuel
cell temperature (TSOFC) on exergy efficiency. The influence of the current density was mentioned earlier. The temperature of the cell first decreases and then increases due to the effect it
has on the voltage drop, and this increase has a greater slope in the upper range of the current density, and this difference in the slope indicates the interaction of these two variables.
Figure 5c. shows the effect of input methane mass flow rate (nCH4) and solid oxide fuel cell temperature (TSOFC) on exergy efficiency. According to the reasons mentioned in the previous
cases, the changes of these variables were investigated and the relative difference of the slopes indicates the mutual effect of the mentioned variables. OPTIMIZATION RESULTS In this
section, according to Fig. 6, the optimal points suggested by Design Expert software are presented. As can be seen, the parameters of A, B and C are respectively 2311.53 A/m2, 0.0068 kmol/s
and 1200 K, as well as the answers of energy efficiency and exergy efficiency at 0.681777% and 0.68345% points are suggested as optimal points. CONCLUSION In this research, the solid oxide
fuel cell system has been analyzed using Design Expert software. Also, the effect of three variables of current density (i), input molar flow rate of methane (nCH4) and solid oxide fuel cell
temperature (TSOFC) on net output power and exergy efficiency responses has been investigated by response surface method. The important results of this study are summarized as follows: *
The energy efficiency and exergy efficiency of the system are 52.28% and 50.43%, respectively. Also, the fuel cell power and net output power are 2424 kW and 2726 kW, respectively. * The
Pvalue is less than 0.05, which indicates the significance of the model at the 95% confidence level. The values of R2 in the net output power and exergy responses are 96% and 87.79%,
respectively. Also, the value of R2adj for the regression model of net output power and exergy efficiency has been calculated as 92.40% and 76.81%, respectively, which shows that this amount
of deviation in responses can be described with the considered model. * The results showed that with increasing current density, net output power and exergy efficiency first increased and
then decreased. By increasing the molar flow rate of methane, the output power has increased. Also, with the increase in fuel cell temperature, the net output power decreased and then
increased. With the increase of methane molar flow rate and cell temperature, the exergy efficiency first decreased and then increased. Also, according to the obtained results, according to
the changes of the slope in the upper and lower range, the parameters have a good interaction with each other. DATA AVAILABILITY All data generated and analyzed during the current study are
available from the corresponding author upon reasonable request. ABBREVIATIONS * Aact : Active surface area (m2) * \(\:\dot{\text{E}}\text{x}\) : exergy rate (kW) * F: Faraday constant
(C/mol) * GT: Gas turbine * \(\:\text{h}\) : specific enthalpy (kJ/kg) * I: Current (A) * i: Current density (A/m2) * ias : Anode-limiting current density (A/m2) * ics : Cathode-limiting
current density (A/m2) * ioa : Exchange current density of anode (A/m2) * ioc : Exchange current density of cathode (A/m2) * GT: Gas turbine * K: Equilibrium constant * L: Thickness of SOFC
layers, cm * LHV: Lower heating value (kJ/kg) * \(\:\dot{\text{m}}\) : mass flow rate (kg/s) * \(\:\dot{\text{n}}\) : molar rate (mol/s) * Ncell : Number of fuel cells * P: Pressure (bar) *
PR: Pressure Ratio * \(\:\dot{\text{Q}}\) : heat transfer rate(kW) * \(\:\stackrel{-}{\text{R}}\) : Universal gas constant (J/mol.K) * rsc : Steam to carbon ratio for SOFC * s: specific
entropy (kJ/kg.K) * SOFC: Solid oxide fuel cell * Uf : Fuel utilization factor * V: voltage(V) * \(\:\dot{\text{W}}\) : lectricity (kW) * \(\:\dot{\text{x}}\) : extent of steam reforming
reaction for methane (mol/s) * \(\:\dot{\text{y}}\) : extent of water gas shift reaction (mol/s) * \(\:\dot{\text{z}}\) : extent of overall electrochemical reaction (mol/s) * a: Anode * AB:
Afterburner * AC: Air compressor * act: activation * c: cathode * D: destruction * elec: Electrolyte * en: Energetic * ex: Exergetic * F: Fuel * FC: Fuel compressor * in: Inlet * int:
interconnect * inv: DC to AC inverter * mix: Mixer * N: Nernst * net: net value * ohm: ohmic * out: Outlet * P: product * ph: Physical * pum: Pump * shift: shifting * Tur: Turbine * tot:
Total value * 1, 2,….: cycle locations * 0: dead state * \(\:{\upeta\:}\) : efficiency REFERENCES * Zhang, X. et al. A review of integration strategies for solid oxide fuel cells. _J. Power
Sources_. 195 (3), 685–702 (2010). Article ADS CAS MATH Google Scholar * Mojaver, P., Khalilarya, S. & Chitsaz, A. Multi-objective optimization using response surface methodology
and exergy analysis of a novel integrated biomass gasification, solid oxide fuel cell and high-temperature sodium heat pipe system. _Appl. Therm. Eng._ 156, 627–639 (2019). Article CAS
Google Scholar * Chinda, P. & Brault, P. The hybrid solid oxide fuel cell (SOFC) and gas turbine (GT) systems steady state modeling. _Int. J. Hydrog. Energy_. 37 (11), 9237–9248 (2012).
Article ADS CAS MATH Google Scholar * Ranjbar, F. et al. Energy and exergy assessments of a novel trigeneration system based on a solid oxide fuel cell. _Energy. Conv. Manag._ 87,
318–327 (2014). Article ADS MATH Google Scholar * Akkaya, A. V. & Sahin, B. A study on performance of solid oxide fuel cell-organic rankine cycle combined system. _Int. J. Energy
Res._ 33 (6), 553–564 (2009). Article CAS MATH Google Scholar * Baniasadi, E. & Dincer, I. Energy and exergy analyses of a combined ammonia-fed solid oxide fuel cell system for
vehicular applications. _Int. J. Hydrog. Energy_. 36 (17), 11128–11136 (2011). Article ADS CAS MATH Google Scholar * Roushenas, R. et al. Thermo-environmental analysis of a novel
cogeneration system based on solid oxide fuel cell (SOFC) and compressed air energy storage (CAES) coupled with turbocharger. _Appl. Therm. Eng._ 181, 115978 (2020). Article CAS MATH
Google Scholar * Ryu, B. R., Duong, P. A. & Kang, H. Comparative analysis of the thermodynamic performances of solid oxide fuel cell–gas turbine integrated systems for marine vessels
using ammonia and hydrogen as fuels. _Int. J. Naval Archit. Ocean. Eng._ 15, 100524 (2023). Article Google Scholar * Soleymani, E., Gargari, S. G. & Ghaebi, H. Thermodynamic and
thermoeconomic analysis of a novel power and hydrogen cogeneration cycle based on solid SOFC. _Renew. Energy_. 177, 495–518 (2021). Article CAS Google Scholar * Chitgar, N. & Moghimi,
M. Design and evaluation of a novel multi-generation system based on SOFC-GT for electricity, fresh water and hydrogen production. _Energy_ 197, 117162 (2020). Article CAS MATH Google
Scholar * Ghaebi, H. & Ahmadi, S. Thermodynamic evaluation of a SOFC-based hybrid system integrated with HDH desalination unit. _Energy Equip. Syst._ 10 (4), 439–457 (2022). MATH
Google Scholar * Fu, C., Fu, C. & Michael, M. _Handbook of Simulation Optimization_ (Springer, 2015). * Box, G. E. & Wilson, K. B. _On the experimental attainment of optimum
conditions_, in _Breakthroughs in statistics: methodology and distribution_. Springer. pp. 270–310. (1992). * Bhattacharya, S. Central composite design for response surface methodology and
its application in pharmacy. In _Response surface methodology in engineering science_. IntechOpen. (2021). * Karami, H. R., Keyhani, M. & Mowla, D. Experimental analysis of drag
reduction in the pipelines with response surface methodology. _J. Petrol. Sci. Eng._ 138, 104–112 (2016). Article CAS MATH Google Scholar * Rahimi-Ahar, Z., Hatamipour, M. S. &
Ghalavand, Y. Experimental investigation of a solar vacuum humidification-dehumidification (VHDH) desalination system. _Desalination_ 437, 73–80 (2018). Article CAS Google Scholar *
Ghalavand, Y., Hatamipour, M. S. & Rahimi, A. _Humidification Compression Desalin. Desalin._, 341: 120–125. (2014). Article CAS Google Scholar * Roy, D., Samanta, S. & Ghosh, S.
Performance optimization through response surface methodology of an integrated biomass gasification based combined heat and power plant employing solid oxide fuel cell and externally fired
gas turbine. _Energy. Conv. Manag._ 222, 113182 (2020). Article CAS MATH Google Scholar * Fei, Z. et al. _Clean and Sustainable power/fresh water/hot air Production Scheme Based on Solid
Oxide fuel cell feed by Apricot Stone Biomass: A multi-attribute Optimization_180p. 808–826 (Process Safety and Environmental Protection, 2023). * Behzadi, A., Gholamian, E., Ahmadi, P.,
Habibollahzade, A. & Ashjaee, M. Energy, exergy and exergoeconomic (3E) analyses and multi-objective optimization of a solar and geothermal based integrated energy system. _Appl. Therm.
Eng._ 143, 1011–1022 (2018). Article CAS MATH Google Scholar * Lavasani, A. M. & Ghaebi, H. Economic and thermodynamic evaluation of a new solid oxide fuel cell based polygeneration
system. _Energy_ 175, 515–533 (2019). Article Google Scholar * Bejan, A., Tsatsaronis, G. & Moran, M. J. _Thermal Design and Optimization_ (Wiley, 1995). * Li, D. Q. et al. Response
surface methods for slope reliability analysis: review and comparison. _Eng. Geol._ 203, 3–14 (2016). Article MATH Google Scholar * Soleimani, S. et al. _Calcium Alginate Hydrogels
Reinforced with Cellulose Nanocrystals for Methylene blue Adsorption: Synthesis, Characterization, and Modelling_192p. 115999 (Industrial Crops and Products, 2023). * Soleymani, E.
Thermodynamic analysis and examining the effects of parameters in BSR-HDH System using response surface methodology. _J. Renew. Energy_. 9 (1), 7873–7889 (2024). MATH Google Scholar *
Yahya, H. S. M., Abbas, T. & Amin, N. A. S. Optimization of hydrogen production via toluene steam reforming over Ni–Co supported modified-activated carbon using ANN coupled GA and RSM.
_Int. J. Hydrog. Energy_. 46 (48), 24632–24651 (2021). Article ADS CAS Google Scholar * Wang, M. S. J., Yan, Z., Dai, Y. & Lu, B. Thermodynamic analysis of a new combined cooling,
heat and power system driven by solid oxide fuel cell based on ammonia–water mixture. _J. Power Sources_. 196 (20), 8463–8471 (2011). Article Google Scholar * Gargari.S, G. & Rahimi.,
M. Energy, exergy, economic and environmental analysis and optimization of a novel biogas-based multigeneration system based on gas turbine-modular Helium Reactor cycle. _Energy. Conv.
Manag._ 185, 816–835 (2019). Article ADS Google Scholar Download references ACKNOWLEDGEMENTS This research was supported by the University of Mohaghegh Ardabili (Research grant number
14339). AUTHOR INFORMATION AUTHORS AND AFFILIATIONS * Department of Mechanical Engineering, Faculty of Engineering, University of Mohaghegh Ardabili, P.O. Box 179, Ardabil, Iran Hadi Ghaebi
& Elahe Soleymani Authors * Hadi Ghaebi View author publications You can also search for this author inPubMed Google Scholar * Elahe Soleymani View author publications You can also
search for this author inPubMed Google Scholar CONTRIBUTIONS Hadi Ghaebi: Methodology, Supervision, Review the first draftElahe Soleymani: Software, writing, formulation. CORRESPONDING
AUTHOR Correspondence to Hadi Ghaebi. ETHICS DECLARATIONS COMPETING INTERESTS The authors declare no competing interests. ADDITIONAL INFORMATION PUBLISHER’S NOTE Springer Nature remains
neutral with regard to jurisdictional claims in published maps and institutional affiliations. RIGHTS AND PERMISSIONS OPEN ACCESS This article is licensed under a Creative Commons
Attribution-NonCommercial-NoDerivatives 4.0 International License, which permits any non-commercial use, sharing, distribution and reproduction in any medium or format, as long as you give
appropriate credit to the original author(s) and the source, provide a link to the Creative Commons licence, and indicate if you modified the licensed material. You do not have permission
under this licence to share adapted material derived from this article or parts of it. The images or other third party material in this article are included in the article’s Creative Commons
licence, unless indicated otherwise in a credit line to the material. If material is not included in the article’s Creative Commons licence and your intended use is not permitted by
statutory regulation or exceeds the permitted use, you will need to obtain permission directly from the copyright holder. To view a copy of this licence, visit
http://creativecommons.org/licenses/by-nc-nd/4.0/. Reprints and permissions ABOUT THIS ARTICLE CITE THIS ARTICLE Ghaebi, H., Soleymani, E. Investigating the effect of parameters in the
thermodynamic analysis of the solid oxide fuel cell cycle using response surface methodology. _Sci Rep_ 15, 181 (2025). https://doi.org/10.1038/s41598-024-84013-y Download citation *
Received: 08 September 2024 * Accepted: 19 December 2024 * Published: 02 January 2025 * DOI: https://doi.org/10.1038/s41598-024-84013-y SHARE THIS ARTICLE Anyone you share the following link
with will be able to read this content: Get shareable link Sorry, a shareable link is not currently available for this article. Copy to clipboard Provided by the Springer Nature SharedIt
content-sharing initiative KEYWORDS * Solid oxide fuel cell * Energy * Exergy * Response surface methodology * Central composite design
Trending News
Awaiting evidence in Pune blast: Shashi TharoorWith investigators trying to unravel the identity of those behind the Pune blast, the government 'may not yet' point fin...
Ultrasensitive lateral-flow assays via plasmonically active antibody-conjugated fluorescent nanoparticlesABSTRACT Lateral-flow assays (LFAs) are rapid and inexpensive, yet they are nearly 1,000-fold less sensitive than labora...
Josh gibson recognized as baseball's career batting leaderNBC’s reality show _The Biggest Loser_ turns dieting into a grueling training regime fit for gladiators. The victor this...
Ribbon cutting ceremony for new virtual health resource center | va butler health care | veterans affairsButler , PA — Join us for the grand opening of the Butler VA Virtual Health Resource Center. WHAT: Join us for the grand...
Correction: corrigendum: a de novo pathological point mutation at the 21–hydroxylase locus: implications for gene conversion in the human genomeARTICLE PDF ADDITIONAL INFORMATION The online version of the original article can be found at 10.1038/ng0393-260 RIGHTS ...
Latests News
Investigating the effect of parameters in the thermodynamic analysis of the solid oxide fuel cell cycle using response surface methodologyABSTRACT In this article, the effect of parameters in the solid oxide fuel cell cycle has investigated using the respons...
Tony robbins-endorsed osteostrong offers tools to reverse osteoporosisOnce a week, Elissa Stein, a spunky 60-year-old partial to hot-pink reading glasses, finds herself in a studio in NYC’s ...
A white house olive branch: no plan to fire muellerAfter a weekend at war with the Mueller investigation, the White House is extending an olive branch. Ty Cobb, the White ...
Rss chief mohan bhagwat's speech to be aired on national television on fridayRSS chief Mohan Bhagwat is all set to deliver a speech on national television on the occasion of Vijayadashami. This wil...
Ten hag names three martinez replacements after man utd drawMartinez went down unchallenged towards the end of normal time, with United then collapsing late on as they threw away a...