The global flood protection benefits of mangroves
The global flood protection benefits of mangroves"
- Select a language for the TTS:
- UK English Female
- UK English Male
- US English Female
- US English Male
- Australian Female
- Australian Male
- Language selected: (auto detect) - EN
Play all audios:
ABSTRACT Coastal flood risks are rising rapidly. We provide high resolution estimates of the economic value of mangroves forests for flood risk reduction every 20 km worldwide. We develop a
probabilistic, process-based valuation of the effects of mangroves on averting damages to people and property. We couple spatially-explicit 2-D hydrodynamic analyses with economic models,
and find that mangroves provide flood protection benefits exceeding $US 65 billion per year. If mangroves were lost, 15 million more people would be flooded annually across the world. Some
of the nations that receive the greatest economic benefits include the USA, China, India and Mexico. Vietnam, India and Bangladesh receive the greatest benefits in terms of people protected.
Many (>45) 20-km coastal stretches particularly those near cities receive more than $US 250 million annually in flood protection benefits from mangroves. These results demonstrate the
value of mangroves as natural coastal defenses at global, national and local scales, which can inform incentives for mangrove conservation and restoration in development, climate adaptation,
disaster risk reduction and insurance. SIMILAR CONTENT BEING VIEWED BY OTHERS MANGROVES AND THEIR SERVICES ARE AT RISK FROM TROPICAL CYCLONES AND SEA LEVEL RISE UNDER CLIMATE CHANGE Article
Open access 05 April 2025 GLOBAL DISTRIBUTION AND DECLINE OF MANGROVE COASTAL PROTECTION EXTENDS FAR BEYOND AREA LOSS Article Open access 26 November 2024 MULTIPLE CLIMATE CHANGE-DRIVEN
TIPPING POINTS FOR COASTAL SYSTEMS Article Open access 30 July 2021 INTRODUCTION Coastal flooding impacts are increasing due to coastal development, population growth1, climate change2,3,
and habitat loss4,5,6,7. In 2017 alone, overall storm damages were more than $US 170 billion in the North Atlantic8. However, development choices often neglect flood risks3,9,10 and there is
growing pressure to adopt flood mitigation and adaptation strategies to reduce these impacts and economic losses9,11,12. In many tropical and subtropical regions mangroves reduce waves and
storm surges, and serve as a first line of defense against flooding and erosion. These benefits are provided through bottom friction, the cross-shore width of forests, tree density and
shape. The aerial roots of a mangroves forest retain sediments, stabilizing the soil of intertidal areas and reducing erosion13. Roots, trunk and canopy dissipates storm surge14 and waves15.
Previous studies have shown that mangroves can reduce up to 66% of wave energy in the first 100 m of forest width15,16. Mangroves can also provide adaptive defenses as they can, under the
right conditions, keep pace with sea-level-rise through vertical accretion17,18,19. Yet, mangroves have experienced significant losses over the last decades, declining globally from 139,777
km2 in 2000 to 131,931 km2 in 201420, with even greater losses before 2000. Most of this loss has happened through the conversion for aquaculture or agriculture and coastal development21.
The loss of these habitats can contribute to increasing coastal risk22, particularly in developed areas with great exposure of coastal populations23,24. Quantifying the value of mangroves as
natural coastal defenses is crucial for incentivizing their conservation and restoration for the benefit of nature and people25. The economic value of mangroves for services that rely on
conserving them, such as flood protection, is typically not included within national budgets and wealth accounts26 in contrast to other services such as timber production. Estimates of flood
protection benefits have been traditionally limited to local27,28 and national29 scale analysis. There are very few global estimates of ecosystem services from wetlands30,31, and none are
based on process-based hydrodynamic flood models. Further, most assessments of the value of mangroves use a benefit transfer or replacement cost method32,33, instead of process-based methods
that can account for local variation in characteristics of storms, mangrove habitat, topography and bathymetry. Field and numerical studies have shown that the capacity of mangroves to act
as natural defenses vary considerably depending on environmental variables from the sources of flooding in the ocean to mangrove characteristics, coastal topography and also the inland
receptors of damage34. In a first, we provide a global analysis of the social and economic value of mangroves for flood risk reduction. This work is based on the approaches developed in
previous research papers29,34,35 and the recommendations of the World Bank36, i.e.: (i) the use of process-based models; (ii) the application of the expected damage function approach for
estimation of damages37,38; and (iii) the assessment of benefits by measuring the flood damages that mangroves avert39,40. We assessed the total expected annual benefits of mangroves
considering both cyclonic (“tropical cyclones”) and non-cyclonic (“regular”) conditions. Global mangrove benefits are quantified by estimating the difference in flood damages between two
scenarios: (i) “with mangroves” (current global extent of mangroves) and (ii) “without mangroves”. For the two scenarios, we use rigorous process-based models to quantify the coastal flood
extents and heights for various storm return periods. We assess the people and property damaged with and without mangroves across 700,000 km of mangrove coastlines globally. The difference
between scenarios is the averted damages or benefits provided by current mangroves. We estimate the extent of inland flooding at 30-m resolution globally. For each mangrove scenario, these
values are summarized in terms of expected annual damages, a metric that expresses the probability of expected dalmages in any year across the full spectrum of storms. The benefits of
mangroves are assessed by the flood damages averted or avoided. RESULTS This probabilistic analysis identifies the places most sensitive in terms of coastal risk to the loss of mangroves at
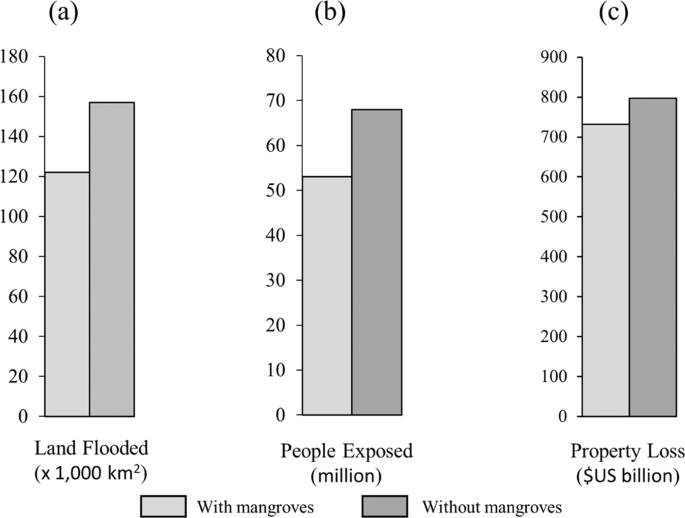
30-m resolution, and aggregate results at global-scale, national-scale (countries) and local-scale (20-km coastal units). MANGROVES AND GLOBAL FLOOD REDUCTION BENEFITS Mangroves annually
reduce property damage by more than $US 65 billion and protect more than 15 million people. If current mangroves were lost 29% more land, 28% more people and 9% more property would be
damaged every year (Fig. 1). These values and benefits can be much higher locally (Fig. 2). The percent risk reduction benefit provided by mangroves is relatively consistent across different
return periods with a trend towards greater benefits for the more intense events (1-in-100-year), except for people protected. For example, property savings go from 7.8% (1-in-10-year) to
9.9% (1-in-100-year). Same patterns are observed in land flooded reduction (25.6–29.8%). However, the percentage of people protected from 1-in-10-year is greater than from 1-in-100-year
(25.6% vs 19.3%) (Table 1). Approximately 90% of total benefits of mangroves are for protection from tropical cyclones, while 10% are from protection from regular (non-cyclonic) conditions
(Supplementary Tables 1 and 2). For example, mangroves reduce annual expected flood damages from tropical cyclones by $US 60 billion and protect 14 million people (Supplementary Table 1).
Meanwhile, they reduce global flooding from regular conditions by $US 5 billion and 1 million people every year (Supplementary Table 2). In general, the benefits from mangroves increase as
the return period increases, becoming more valuable during more intense events (i.e., 1-in-100-year) which are rare but cause significant flood damages (Table 1). If mangroves were lost,
property losses produced by 1-in-100-year flood events would increase by 37 million people and US$ 270 billion (Table 1). However, for tropical cyclones, mangrove benefits increase sharply
after reaching a storm intensity associated to the 1-in-50-year return period events (Supplementary Table 1). MANGROVES AND NATIONAL FLOOD REDUCTION BENEFITS The flood protection benefits of
mangroves vary significantly across regions and countries due to differences in flood characteristics, mangroves extents and the degree of exposure. Overall mangroves provide the greatest
benefits in the Western Pacific and Caribbean islands world (Table 2 and Supplementary Figs. 1–3). The countries that receive the greatest annual economic benefits from mangroves are
typically more developed states and territories: United States, China and Taiwan. These areas principally benefit from mangroves in terms of the high value and density of coastal assets that
are protected. Vietnam, India and Bangladesh benefit the most from mangroves in terms of people protected due to the high density of coastal populations in these countries (Table 2).
Indeed, the national importance of mangroves for flood protection varies considerably when considering these benefits as a percentage of national GDP. For example, in Belize, Suriname and
Mozambique, the flood protection benefits from mangroves account for over 15% of the national GDP. Mangroves provide critical flood protection benefits in countries with lower GDPs where
exposure is concentrated along vulnerable coastlines; for example, Mozambique and Bangladesh, 7th and 9th respectively in terms of mangroves benefits. These countries receive over $US 1
billion in benefits annually from mangroves due to the high densities of assets in exposed coastal areas (see Supplementary Fig. 3 for relative property benefits distribution). The benefits
of mangroves from cyclones are particularly high for countries such as Mexico, India and Vietnam. For countries, where cyclones are not as common such Japan and China, mangroves can still
provide significant benefits from more common high waves and swell. There are also nations (e.g. Australia and United Arab Emirates) where mangroves protect the same from tropical cyclones
and regular climate (Supplementary Tables 3 and 4). MANGROVES AND LOCAL FLOOD REDUCTION BENEFITS Mangroves also provide significant flood protection benefits to several coastal cities and
regions (Fig. 2). In many of these cities, mangroves protect a considerable number of people from flooding annually (Fig. 2a). For example, in Abidjan and Lagos in West Africa, Mumbai and
Karachi in South Asia, Wenzhou in East Asia, and Cebu and Denpasar in South-east Asia existing mangroves protect more than 150,000 people from flooding every year. In some cities like Miami
in the U.S.A and Cancun in Mexico mangroves provide more than $US 500 million in avoided property damages every year (Fig. 2b). However, mangrove benefits are not limited to urban areas and
extend to less populated coastal floodplains. DISCUSSION This study provides the first global analysis of the economic value of mangroves for flood protection. Where they remain, mangroves
reduce risks by protecting coastlines against flooding from waves and storm surge. They protect lives, prevent damages to assets critical to livelihoods and reduce socio-economic
vulnerability. Many important benefits do go to developed nations particularly to some of those with smaller economies (lower GDP) that are least able to respond to disasters. Mangroves
forests around the world have faced extensive loss and degradation due to ditching, loss to open water or conversion to other land-uses20. By quantifying the value of mangroves in terms of
economic benefits to people and property globally, this study helps demonstrate the importance of conserving mangroves where they exist today. While global scale results are best suited for
identifying hotspots in services provided by country or region34, local and national levels are appropriate for project design, implementation and cost-benefit analysis29. Mangroves provide
significant annual flood protection savings for people and property both from cyclones and the more regular (non-cyclonic) high wave and swell events. However, cyclonic events are when
damages are the greatest and mangroves offer the greatest benefit. With climate change the intensity and frequency of the largest events are likely to increase and thus the role of mangroves
will therefore be even more relevant in future scenarios. The greatest economic benefits are received by USA and China. These are highly developed nations where mangroves have been severely
degraded by coastal development. Nonetheless the remaining mangroves provide significant values annually in states, territories and provinces such as Florida (USA). Developing countries and
small islands are the most vulnerable to mangroves loss. These countries receive benefit from the greatest economic protection relative to the GDP (e.g. Belize, Suriname, Mozambique,
Bahamas, Anguilla, Guyana and Madagascar). The influence of mangroves on flooding varies spatially at a national level. Mangroves in some countries have an apparently greater effect on
flooding due to unique combinations of hazard, ecosystem and exposure characteristics. For example, while the total extent of mangroves in Indonesia is nearly 6.5 times that of Cuba20, Cuba
receives significantly higher protection from mangroves in terms of flood extents (4.5 times more land protected). This discrepancy can be explained by the fact that the value of mangroves
for flood protection depends significantly on the coastal length of mangroves even more than the width of the mangroves forest. Previous studies have shown that the flood reduction benefits
from mangroves and other coastal wetlands, particularly from waves, are highly non-linear on forest width35,41. This implies that coastlines with longer mangroves belts, such as in Cuba, may
benefit more in terms of flood reduction42. Differences in these results can also arise due to differences in inland topography behind these mangroves. Mangrove benefits tend to be higher
on flatter floodplains where storm surges travel far, relative to steeper floodplains. By showing where mangroves are most valuable in terms of both people and property protected, this study
provides important insights for where to prioritize restoration efforts. Local scale analysis highlights the hotspots where mangroves provide the greatest benefits. For example, mangroves
provide relevant benefits throughout the Philippines, but these values are higher in the central and northern regions of the country, as they are the areas that receive the greatest annual
impact from typhoons. In addition, mangroves provide benefits especially in densely populated lowland areas, such as in the Ganges-Brahmaputra delta in India and Bangladesh; also, in the
Mekong delta in Vietnam; or in the Amazon delta in northern Brazil. These regions are highly sensitive to climate hazards and therefore need specific risk reduction strategies (e.g. UNISDR
201511). It is in the most vulnerable areas where mangroves play the most important role in reducing risk by minimizing flood exposure and, therefore, the number of people likely to be
affected by such events. Mangroves were and are often filled, ditched, diked and dredged to build coastal infrastructure from airports to ports, hotels and housing developments. In these
areas few mangroves remain in front of these properties to provide protections. Remaining mangroves however particularly protect communities and sometimes the most socially vulnerable
communities at least with respect to poverty and income29. Our flood maps “with mangroves” provide some of the current best risk assessments available for many countries (e.g. Supplementary
Figs. 4 and 5). This global flood risk analysis improves on earlier global flooding analyses3,9,10. Our work is based on a fully probabilistic approach and we followed a multistep
methodology based on process models, in combination with statistical downscaling, to simulate wave and surge interaction with mangroves and predict flood impacts along the coast. We examine
waves and surge in both cyclonic and more regular (non- cyclonic) conditions. We assess flooding of land at very high resolution (flood maps and risk maps at 30-m resolution worldwide).
Valuing mangroves at global, national and local scales provides a consistent screening of the magnitude of ecosystem benefits, allows to identify the greatest nature-dependent areas
(priority management zones) and highlights the cost-efficient solutions. To assess flooding globally, we make a number of key assumptions and simplifications, which are summarized here and
cover in depth in Supplementary Table 9. We developed and validated a key storm model with high-resolution analyses for the Philippines29,43. A global reanalysis of tropical cyclone storm
surges has not been available during the development of this work, we developed and validated a regression model based on the country with the broadest range of storm intensities, mangroves
characteristics and coastline (Supplementary Fig. 7). Other regional studies that include tropical cyclone reanalysis underestimate storm surge (e.g. Haiyan typhoon)44. However, our model is
able to accurately capture these extreme events, as we demonstrated in the Philippines (Supplementary Fig. 11). In the future, all coastal flood risk models will be improved by better data
on bathymetry, topography, and mangroves as well as better models of the two-dimensional propagations of nearshore waves and storm surge. For consistency and computational savings, we have
used global datasets and time-efficient modeling tools. We have examined issues of model sensitivities in depth elsewhere43. Because this is a global flooding model, we excluded some
countries that had very few mangroves (less than 100 ha) and we also capped the benefits per hectare at $US 50,000 as these were the highest values estimated in a high resolution analysis,
risk industry model of mangrove benefits in Florida (Narayan _et al_. 2019) (see Supplementary Table 8). This excluded 15 countries in total, including Bahrain and Benin, which had very high
values of benefits/ha; as well as eight Caribbean Small Island Developing States (Supplementary Table 9). These models and results inform new opportunities to pay for the management,
conservation and restoration of mangroves to cost effectively reduce risks to people and property. There is strong interest among the management, financing and donor sectors for solutions in
disaster risk reduction and climate adaptation particularly as payments from national governments and insurers are growing nearly exponentially for disaster management45. Many governments
subsidize risk, which creates perverse incentives for greater coastal development, loss of ecosystems, and reduced opportunities for private insurance. By quantifying the values of coastal
mangroves, this opens opportunities to align their conservation with coastal protection of existing public infrastructure and private developments. The approaches we use here for assessing
flood risk and the benefits of mangroves as risk reduction solutions are consistent with those used by national disaster risk agencies (e.g., the US Federal Emergency Management Agency),
coastal engineers (e.g. the U.S. Army Corps of Engineers), private insurers and re-insurers, climate adaption funders (e.g., Green Climate Fund), and the World Bank46,47. By using widely
accepted approaches to measure the benefits and cost-effectiveness of mangroves, these results open opportunities to support the management and restoration of mangroves as national coastal
infrastructure using hazard mitigation and disaster recovery funds. These values can also be used to underpin the development of innovative insurance options like those being developed and
implemented for coral reefs45,48,49. These spatially explicit values can be used directly in national adaptation and risk management plans associated with the United Nations Conventions on
Climate Change and Disaster Risk Reduction (UNFCCC and UNSIDR). These values could also be used to inform the development of resilience credits for climate adaptation, similar to the
development of credits for blue carbon (for climate mitigation) in mangroves. By demonstrating where mangroves provide flood protection benefits across the world, this study helps inform
wider discussions on where it is most optimal to invest in efforts to restore and manage mangroves for the critical ecosystem services they provide. METHODS METHODS AT A GLANCE This work
measures the flood protection service of mangroves all over the world for two climatic conditions: (1) Cyclonic- i.e., the conditions high-intensity extreme waves and storm surge induced by
tropical cyclones and (2) Non-cyclonic, i.e., the “regular” waves generated by low-intensity local storms. We followed the Expected Damage Function (EDF) approach50, recommended by the World
Bank36, previously applied in coral reefs ecosystems34 and commonly used in engineering and insurance sectors51,52. We examine the role of mangroves in reducing flood risks by measuring the
impacts of flooding on people and property under two different scenarios: with and without mangroves. The “without mangroves” scenario assumes the complete loss of mangrove habitat and the
consequent erosion of the intertidal area with a smoothened bottom roughness. We use a regression model globally, to calculate coastal flooding by analyzing more than 7,000 historical
cyclones53 and 32 years of regular waves and sea level (storm surge, astronomical tide and mean sea level). Flood impacts (i.e. land flooded) for the with and without mangrove scenarios are
combined with global distributions of people and property11, and with vulnerability based on global “Flood Depth-Damage Functions”54 to assess baseline flood damages and flood damages after
mangrove loss for multiple storm events and on an annual basis. To identify the mangroves that influence a given coastal region and evaluating nearshore hydrodynamics and flood height we
define cross-shore coastal profiles (Supplementary Fig. 6d). Then, we follow a multi-step framework whose key aspects are described here and in the Supplementary Material: (1) Estimate
offshore dynamics produced from both, tropical cyclones and regular climate conditions. (2) Estimate nearshore dynamics by downscaling offshore waves and storm surge until shallow water,
just before mangrove habitats. (3) Propagate waves and storm surge through mangroves and obtain the flood height behind the mangroves at the shoreward end of each profile. (4) Estimate the
land flooded (impact) due to extreme water levels along the shore by intersecting the flood height at the shoreline with inland topography (5) Calculate land, people and property located in
the flooded area and, finally, apply the corresponding damage functions to obtain flood damages with and without mangroves. STUDY DOMAIN DESCRIPTION This global study covers 700,000 km of
coastline that includes more than 141,000 km2 of mangroves, spread over 4 continents and more than 9,500 islands. To reduce the vast computational requirements such a large domain requires,
the global domain is divided at three levels, from global to regional and local (Supplementary Fig. 6). The first level is a global division into six macro-regions corresponding to the
following ocean basins of tropical cyclone generation53: East Pacific, North Atlantic, North Indian, South Indian, West Pacific and South Pacific (Supplementary Fig. 6, panel “a”). The
second level divides the 700,000 km of global mangrove coastline into 68 sub-regions considering coastline transects of similar coastal typology (e.g. islands or continental coasts) and
similar ecosystem characteristics (Supplementary Fig. 6, panel “b”). The third level of disaggregation is done at a local scale, defining units with 20-km length of coastline and extending
up to 30-km inland and 10 km seaward (Supplementary Fig. 6, panel “c”). Within these units cross-shore profiles perpendicular to the mangrove habitats are created for each kilometer of
mangrove coastline, totaling 700,000 profiles (Supplementary Fig. 6, panel “d”). BUILDING THE GLOBAL MODEL BASED ON THE PHILIPPINES RESULTS Global reanalysis of ocean and coastal waves55,56
and storm surge57 exist though not for tropical cyclones during the course of this work. We develop the global model based on an extensive re-analysis of tropical cyclone climates developed
for the Philippines29. We chose the Philippines as the baseline case to develop our own tropical cyclone reanalysis at high resolution and estimate flood damages in presence and absence of
mangroves. There are three main reasons that make the Philippines an excellent pilot case for valuation of the coastal protection ecosystem service provided by mangroves: (i) Almost 10% (548
events) of the global tropical cyclone records from IBTrACS database affected the Philippines53. The worldwide distribution of tropical cyclone parameters (velocity track, wind speed)
closely resemble these events in the Philippines (Supplementary Fig. 7) (ii) The islands of the Philippines present high climatic variability and it is at particularly risk from natural
hazards like typhoons and regular storms, which are the cause of 80% of the total losses from disasters [average loss totaling nearly $US 3 billion, 29% of this damage is due to coastal
flooding58]. (iii) The Philippines ranks in the top 15 most mangrove habitat-rich countries, with 2,630 \(k{m}^{2}\) in 2010, representing 2% of the world total59. These mangrove habitats
show extensive variation in both cross-shore length and average depth. Mangroves in the Philippines rage between 0.1 km and 8 km wide and between 0 m and 10 m depth (Supplementary Figs. 8
and 9). We valued flood protection service of mangroves in the Philippines by using the numerical model Delft3D considering both historical tropical cyclones and regular climate conditions
with and without mangroves. We use these results to build two global statistical models. The first global model is developed to obtain offshore and nearshore ocean dynamics produced by
tropical cyclones (wave height, peak period, storm surge and storm duration), and the second global model to estimate how the presence and profile of mangrove habitats influence the total
water level on the shoreline. Further details of the two models are developed below: MODEL 1: OFFSHORE AND NEARSHORE DYNAMICS GENERATED BY TROPICAL CYCLONES Offshore waves and storm surge
generated by tropical cyclones (IBTrACS database) were numerically simulated in the Philippines by using Delft3D modules “Flow”60 and “Wave”61. Both modules were run simultaneously in a
2-dimensional grid of 5 km cell-size with a time step of 30 s, forced with hourly wind data and sea level pressure fields obtained from parametric model, in which the non-linear interaction
processes of tide, wind setup, inverse barometers and wave setup are considered. The model was validated by comparing the storm surge generated by typhoon Rammasun, in Legaspi and Subic Bay.
We use tidal gauges registers from the Global Sea Level Observing System (GLOSS, http://www.gloss-sealevel.org) for validation (Supplementary Fig. 11). Using the results of the numerical
simulations carried out with the Delft3D model in the Philippines we look for statistical relationships between cyclone parameters and oceanographic variables to create a new predictive
model, where oceanographic variables (wave height, period, weather tide and duration of the storm peak) are predicted based on cyclone parameters (distance, wind speed, track velocity, wind
angle of incidence). In the Philippines, 548 events were simulated on a two-dimensional grid of 5 km cell size, finally creating a database of 58 million results. We randomly select 90% of
the generated results to build our predictive model, and use the other 10% for validating the predictive models. We estimate the correlation between physical tropical cyclone parameters
(distance from the trace to the profile _D_ [km], wind speed _W_ [km/h], cyclone travel speed _V_ [km/h], wind direction from north _θ__WN_, [in degrees] and the angle between the wind
direction-profile _θ__WP_ [in degrees]) and the oceanographic variables at the target point (maximum significant wave height produced during the event at the target point _H__smax_ [in m],
peak period _Tp_ [in s], maximum storm surge _SS__max_ [in m] and maximum storm surge duration, _T__SSmax_). We increase the accuracy of the analysis by dividing the data into two groups:
Coastal areas directly exposed to tropical cyclones and areas protected from the direct impact of tropical cyclones (Supplementary Fig. 13). For each combination (5 cyclone variables x
3-time instants x 4 oceanographic variables = 60 cases), we estimate the Pearson coefficient (Pxy), which statistically quantifies the degree of correlation between the cyclone variables “X”
and the oceanographic variables “Y” (equation S.1). We then adjust ocean climate variables (Yi) to our parametric model [equation S.2]. We test this adjustment for one, two, three and four
independent variables (Xi), so that we can cover all the alternatives and, based on the correlation coefficient of each one, choose the best regression model.
$${{\rm{Y}}}_{{\rm{s}}}={{\rm{a}}}_{0}+{{\rm{a}}}_{1}\cdot {{{\rm{X}}}_{1}}^{{\rm{\alpha }}1}+{{\rm{a}}}_{2}\cdot {{{\rm{X}}}_{2}}^{{\rm{\alpha }}2}+\ldots +{{\rm{a}}}_{{\rm{n}}}\cdot
{{{\rm{X}}}_{{\rm{n}}}}^{{\rm{\alpha }}{\rm{n}}}$$ (1) Where Y could be either the maximum wave height (Hsmax), the peak period (Tp), the maximum meteorological tide (SSmax) and the duration
of the meteorological peak produced by the cyclone (Tssmax). Meanwhile, X could be any of the following predictor variables (see equations S.3 to S.10): minimum distance between the storm
track and the target point (Dmin), the wind speed when the tropical cyclone is at the closest location to the target point (Wdist_min), the average wind speed during along the storm length
(Wmean), the mean direction of wind respect to the North (θWN_mean), the wind direction respect to the North at the minimum distance point (θWN_dist_min), the average track velocity (Vmean),
the track velocity at the minimum distance point (Vdist_min) and is the track velocity at the moment of maximum wind speed (Vwind_max). MODEL 2: THE ROLE OF COASTAL HABITATS IN NEARSHORE
DYNAMICS (FLOOD HEIGHT) Coastal vegetation provides resistance to the energy and flow of waves and water as they come onshore which is modeled by using a friction factor. Mangroves are then
modeled in terms of an equivalent roughness [e.g. Sheppard friction for coral reefs62] based on Manning coefficient. In the Philippines we classify surface types into three groups: sandy
soil (n = 0.02)63, mangroves (n = 0.14)63 and coral reefs (n = 0.05)64. 1-dimensional numerical propagations are carried out using the Delft3D model to obtain flood heights along the coast
(Supplementary Figs. 8 and 9). We use these numerical results to create two interpolation tables (for both, regular climate and tropical cyclones) that correlate the climatic information at
seaward side of the profile (Hs, Tp, SS and Tss, being this last only specific of tropical cyclones) and the characteristics of the mangrove profiles (width and average depth) with the flood
height (i.e. total water level along the coast). These tables contain 37,500 tropical cyclone simulations (50 cyclones × 750 profiles) and 90,000 regular climate simulations (120 sea states
× 750 profiles). These two models described above are integrated in the multi-step framework applied globally for valuing the flood protection role of mangroves: STEP 1: OFFSHORE DYNAMICS
The offshore hydrodynamic conditions (wave height, wave period, storm surge and astronomical tide) were subdivided in two groups: (1) those produced by local extreme events (tropical
cyclones) and (2) those produced by less intense local climate or extreme climate generated far away from the study area (regular climate). REGULAR CLIMATE is defined by different datasets
within the period 1979–2010: a global wave reanalysis56, a global storm surge reanalysis57, astronomical tide65,66 and mean sea level compiled from historical numerical reconstruction and
satellite altimetry67. Waves and sea level conditions due to tropical cyclones are excluded and studied separately to avoid double counting. TROPICAL CYCLONES were considered separately from
regular climate only if two conditions are satisfied: (1) they are generated within the same ocean basin than the study area and the cyclone passes closer than 500 km from the coastline,
and (2) 10-minute sustained wind speeds (W10m) exceed 118 km/h. Tropical depressions (W10m ≤ 62 km/h) and tropical storms (63 km/h ≤ W10m ≤ 118 km/h) are studied together with regular
climate. For historical tropical cyclones, we used IBTrACS database53, which provides 6-hourly data of wind speed, atmospheric pressure and position. Since global reanalysis of tropical
cyclones that include waves do not exist, we use a statistical model (Equations S.3 to S.10) created from the Philippines results to calculate offshore wave height, peak period, storm surge
and storm surge duration just in the limit between deep and shallow water. STEP 2: NEARSHORE DYNAMICS Once we resolve offshore dynamics, we obtain waves and storm surge in the seaward side
of each cross-shore profile. Waves interact with the bottom and other obstacles (e.g. islands) as they approach the coast and modify height and direction through shoaling, refraction,
diffraction and breaking processes. REGULAR CLIMATE is propagated following a hybrid downscaling. The 32-year long series, from 1979 to 2010, include 280,000 sea states (1 sea state is
1-hour register of wave height, peak period and total water level). To each profile, we allocate the closest point of the offshore databases. Considering all, the 700,000 coastal profiles
and the 280,000 sea states results in an unmanageable number of cases. We reduce the number of sea-state propagations by, firstly, considering only the 3,787 non-repeated combinations of
wave height, peak period and total water level (SS + AT + MSL) and, then, applying The Maximum Dissimilarity Algorithm (MDA68,69) to finally obtain 120 sea states to be propagated with Snell
law and shoaling equation (Eqs. 1 and 2). Meanwhile, TROPICAL CYCLONE nearshore hydrodynamics are obtained by means of the previously derived regression model (equations S.3 to S.10). We
apply regression models in each profile, and we obtain the same parameters as for regular climate, in addition to the time duration of the meteorological tide (Tss).
$${H}_{s\_perfil}={H}_{s\_off}\cdot \sqrt{\frac{{C}_{off}}{{C}_{perfil}}}\cdot \sqrt{\frac{\cos \,{\theta }_{off}}{\cos \,{\theta }_{perfil}}}$$ (2) $${\rm{Snell}}:\frac{{C}_{off}}{\cos
\,{\theta }_{off}}=\frac{{C}_{perfil}}{\cos \,{\theta }_{perfil}}$$ (3) STEP 3: MODELING THE ROLE OF COASTAL HABITATS IN NEARSHORE DYNAMICS, FLOOD HEIGHT The next step consists on
propagating ocean hydrodynamics over mangroves forest which dissipate wave and surge energy, and, consequently, reduce flood height. Flood height is a function of mean sea level,
astronomical tide and run-up of waves. Mangroves dissipation takes place by means of breaking and friction processes. Given the large scale of this global analysis, we follow a simplified
approach for vegetation modeling. We use the interpolation table from the Philippines to infer the resulting flood height given mangrove length and depth, significant wave height, peak
period and total water level at the head of each cross-shore profile. Then, we apply the statistical reconstruction technique RBF (Radial Basis Functions)70 to calculate in each profile the
complete historical flood height time series. Next, we carry out an extreme value analysis. First, we select maximum values on a variable threshold (minimum, 1-in-5-year event). We adjust
these selected values to a Generalized Pareto-Poisson distribution, and we obtain the flood height vs return period curves for both scenarios: with and without mangroves. We observe a high
spatial variability of flood height produced by tropical cyclones along worldwide coastlines, which highlights the importance of addressing global flood risk analysis at high resolutions to
consider local topographic and bathymetric variations (e.g. 1-in-100-year flood in Vietnam, Supplementary Fig. 10). We assume that countries with less than 100 ha of mangroves were excluded
from the analyses as there were too few mangroves to reliably estimate benefits using a global model. This excluded 15 countries in total, including Bahrain and Benin, which had some of the
most over-estimated values of benefit/ha; as well as eight Caribbean Small Island Developing States (Supplementary Table 9). STEP 4: CALCULATING IMPACTS: FLOODING MAPS Uncoupling wave and
surge propagation from the flooding process allows us to freely choose the most accurate flooding method. Other alternative strategies exist, but they are unapproachable at global scale due
to its computational cost and high-quality data required, usually unavailable at global scale (e.g. using coupled phase resolving models or phase averaged models). To obtain flood maps by
means of uncoupling propagation and flooding processes require: (i) the flood height along the coast with high enough resolution to avoid significant longshore gradients, (ii) a good DTM
(Digital Terrain Model) and (iii) a flooding method (flood models). Separating flooding process from waves and sea level propagation gives us more flexibility to adapt the flooding approach
to the elevation data. Local scale analyses (<100 km of coastline) with high resolution DTM (<10 m) could be addressed by using process-based flood models, like RFSM-EDA (Rapid Flood
Spreading Method – Explicit Diffusion wave with Acceleration term)71,72. However, larger scale´s (>100 km) with coarser DTM (>10 m), require fast and less precise techniques, such as
“bathtub” method, based on hydraulic connectivity which consists of merge points below the flood height. We use this last strategy to address global flooding in presence and absence of
mangroves. The flood extent is estimated globally by using a 30-meter SRTM-DTM (Shuttle Radar Topography Mission)73. STEP 5: ASSESSING GLOBAL FLOOD CONSEQUENCES IN MANGROVES PROTECTED AREAS
Mangrove benefits are assessed in terms of avoided damages to people and property. Property value is directly obtained as the sum of industrial and residential stock from GAR15, at 5 km
resolution worldwide11. The suitability of this database to be used in global assessments of coastal flooding exposure and damage lies on the fact that it integrates homogeneous global
population and country‐specific building typology, use and value data74. The consistency of the methodological approach used in the development of GAR15, as well as the choice of the best
data currently available for its implementation, have produced a product fully adapted to the needs of the global model of the evaluation of probabilistic risk74. Consequently, GAR15 is the
most appropriate source of data available for global scale analysis, looking for an order of magnitude of the value of adequate protection for mangroves, usually used by critical
stakeholders such as the World Bank75. People distribution comes from the freely available 1 km resolution database GPW (Gridded Population of the World), from SEDAC (Socioeconomic Data
& Applications Center). To be consistent with flood layer grid resolution (30-m) it is necessary to redistribute people and property over a finer mesh. We apply a downscaling method, in
which the re-distributed values are calibrated with the other existing data of people distribution (WorldPop) by imposing as boundary condition that the total sum of the assets re-scaled to
30 meters in each region was equal to the sum of those same assets without re-scaling in the same control zone. The sensitivity of people and stock to different levels of flooding is
obtained through different damage functions. Damage functions provide information of the number of people affected by coastal flooding and the stock losses, according to the water depth. We
use different damage functions for population and for stock. Population damage is based on the hypothesis that water depths below 0.5 meters do not affect people, while water depths above
0.5 meters affect 100% of people hit by flooding. It is a common practice in the scientific literature not to use damage functions to calculate the population affected by floods3. This
option overestimates the results obtained; therefore, it is recommended to opt for a certain threshold below which the effects of flooding are not considered54. This threshold is set at 0.5
meters because it is a common value used by emergency services (Japan, Netherlands, USA) in determining whether or not it is necessary to evacuate people from an area under threat. In case
of stock, we adapted the global flood depth-damage functions from Huizinga/JRC (Joint Research Centre) broken down by continent (Africa, Asia, Oceania, North America, South America and
Central America) and by asset type: residential and industrial54. Average values of damage at different water depths are provided in Supplementary Table 5. Finally, flood risk (magnitude and
probability) is obtained by combining damage curves with people and property exposure distribution. Then, we integrate the return period curves to obtain the Expected Annual Damages and
Benefits at each 20-km study unit. We can thus show global information on annual flood damage anywhere and with a spatial resolution high enough to be incorporated into coastal planning and
ecosystem conservation policies. MODELING ASSUMPTIONS To provide a more nuance discussion of the strengths and weaknesses of the modelling approach, we have included a table with all the
assumptions stablished at each step of the methodology, as well as the corresponding reference to the existing literature where this assumption is applied and validated (Supplementary Table
9). This table summarizes the assumptions considered in this work and may help the reader to assess how strong the assumptions are and potentially identify areas for future work. DATA
AVAILABILITY The data that support the findings of this study are available online at: https://osf.io/ecs4p/ (DOI 10.17605/OSF.IO/ECS4P). CODE AVAILABILITY The MATLAB codes for key analyses
are available on request from the corresponding author at [email protected]. REFERENCES * Neumann, B., Vafeidis, A. T., Zimmermann, J. & Nicholls, R. J. Future Coastal Population Growth
and Exposure to Sea-Level Rise and Coastal Flooding - A Global Assessment., https://doi.org/10.1371/journal.pone.0118571 (2015). Article PubMed PubMed Central CAS Google Scholar *
Kumar, L. & Taylor, S. Exposure of coastal built assets in the South Pacific to climate risks. _Nat. Clim. Chang._ 5, 992–996 (2015). Article ADS Google Scholar * Hallegatte, S.,
Green, C., Nicholls, R. J. & Corfee-Morlot, J. Future flood losses in major coastal cities. _Nat. Clim. Chang._ 3, 802–806 (2013). Article ADS Google Scholar * Gilman, E. L., Ellison,
J., Duke, N. C. & Field, C. Threats to mangroves from climate change and adaptation options: A review. _Aquat. Bot._ 89, 237–250 (2008). Article Google Scholar * Burke, L., Reytar,
K., Spaulding, M. & Allison, P. _Reefs at Risk Revisited_. (2011). * Spalding, M. D., Brumbaugh, R. D. & Landis, E. Atlas of Ocean Wealth. _Nat. Conserv. Arlington, VA_ (2016). *
Zedler, J. B. & Kercher, S. WETLAND RESOURCES: Status, Trends, Ecosystem Services, and Restorability. _Annu. Rev. Environ. Resour._ 30, 39–74 (2005). Article Google Scholar * Löw, P.
Hurricanes cause record losses in 2017 - The year in figures (Munich Re NatCatSERVICE) (2018). * Hinkel, J. _et al_. Coastal flood damage and adaptation costs under 21st century sea-level
rise. _Proc. Natl. Acad. Sci._ 111, 3292–3297 (2014). Article ADS CAS PubMed Google Scholar * Reguero, B. G., Losada, I. J., Díaz-Simal, P., Méndez, F. J. & Beck, M. W. Effects of
climate change on exposure to coastal flooding in Latin America and the Caribbean. _PLoS One_ 10, 1–19 (2015). Article CAS Google Scholar * UNISDR. _Making Development Sustainable: The
Future of Disaster Risk Management. Global Assessment Report on Disaster Risk Reduction. International Stratergy for Disaster Reduction (ISDR)_, 9789211320282 (2015). * Council, N. R.
_Reducing Coastal Risks on the East and Gulf Coasts_. (The National Academies Press., 2014). * Thampanya, U., Vermaat, J. E., Sinsakul, S. & Panapitukkul, N. Coastal erosion and mangrove
progradation of Southern Thailand. _Estuar. Coast. Shelf Sci._ 68, 75–85 (2006). Article ADS Google Scholar * Mcivor, A., Spencer, T. & Möller, I. Storm Surge Reduction by Mangroves.
_Nat. Coast. Prot. Ser_. 35 ISSN 2050-7941 (2012). * Mcivor, A., Möller, I., Spencer, T. & Spalding, M. Reduction of Wind and Swell Waves by Mangroves. _Nat. Coast. Prot. Ser_. 1–27
ISSN 2050–7941 (2012). * McIvor, A., Spencer, T., Möller, I. & Spalding, M. 2| Coastal Defense Services Provided by Mangroves. _Manag. Coasts with Nat. Solut_. 24 (2016). * McKee, K. L.
Biophysical controls on accretion and elevation change in Caribbean mangrove ecosystems. _Estuar. Coast. Shelf Sci._ 91, 475–483 (2011). Article ADS Google Scholar * Mckee, K. L., Cahoon,
D. R. & Feller, I. C. Caribbean mangroves adjust to rising sea level through biotic controls on change in soil elevation. _Glob. Ecol. Biogeogr._ 16, 545–556 (2007). Article Google
Scholar * Krauss, K. W. _et al_. How mangrove forests adjust to rising sea level. 19–34, https://doi.org/10.1111/nph.12605 (2013). Article PubMed Google Scholar * Hamilton, S. E. &
Casey, D. Creation of a high spatio-temporal resolution global database of continuous mangrove forest cover for the 21st century (CGMFC-21). 729–738, https://doi.org/10.1111/geb.12449
(2016). Article Google Scholar * Alongi, D. M. Present state and future of the world’s mangrove forests. _Environ.Conserv._ 29, 331–349 (2002). Article Google Scholar * Giri, C. _et al_.
Distribution and dynamics of mangrove forests of South Asia. _J. Environ. Manage._ 148, 101–111 (2015). Article PubMed Google Scholar * Hilft, B. E. & United Nations University
Institute for Environment and Human Security (UNU-EHS)(2014). _World Risk Rep_. _2014_ (2012). * Spalding, M., Kainuma, M. & L., C. _World atlas of mangroves. A collaborative project of
ITTO, ISME_, _FAO_, _UNEP-WCMC_. (2010). * Hochard, J. P., Hamilton, S. & Barbier, E. B. Mangroves shelter coastal economic activity from cyclones.
https://doi.org/10.1073/pnas.1820067116 (2019). Article CAS Google Scholar * Das, S. & Vincent, J. R. Mangroves protected villages and reduced death toll during Indian super cyclone.
_Proc. Natl. Acad. Sci._ 106, 7357–7360 (2009). Article ADS CAS PubMed Google Scholar * Pandeya, B. _et al_. A comparative analysis of ecosystem services valuation approaches for
application at the local scale and in data scarce regions. 22, 250–259 (2016). * Menéndez, P., Losada, I. J., Torres-Ortega, S., Toimil, A. & Beck, M. W. Assessing the effects of using
high-quality data and high-resolution models in valuing flood protection services of mangroves. _PLoS One_ 14, e0220941 (2019). Article PubMed PubMed Central CAS Google Scholar *
Menéndez, P. _et al_. Valuing the protection services of mangroves at national scale: The Philippines. _Ecosyst. Serv._ 34, 24–36 (2018). Article Google Scholar * Costanza, R. _et al_. The
value of the world’s ecosystem services and natural capital. _Nature_ 387, 253–260 (1997). Article ADS CAS Google Scholar * Costanza, R. _et al_. Changes in the global value of
ecosystem services. _Glob. Environ. Chang._ 26, 152–158 (2014). Article Google Scholar * Boyer, T. & Polasky, S. Valuing urban wetlands: A review of non-market valuation studies.
_Wetlands_ 24, 744–755 (2004). Article Google Scholar * Himes-Cornell, A. H., Grose, S. O. & Pendleton, L. Mangrove ecosystem service values and methodological approaches to valuation:
Where do we stand? _Front. Mar. Sci._ 5, 1–15 (2018). Article Google Scholar * Beck, M. W. _et al_. The global flood protection savings provided by coral reefs. _Nat. Commun_.,
https://doi.org/10.1038/s41467-018-04568-z (2017). * Barbier, E. B., Georgiou, I. Y., Enchelmeyer, B. & Reed, D. J. The Value of Wetlands in Protecting Southeast Louisiana from Hurricane
Storm Surges. _PLoS One_ 8, 1–6 (2013). Article CAS Google Scholar * Beck, M. W. & Lange, G. M. _Wealth Accounting and the Valuation of Ecosystem Services Partnership (WAVES). 2016.
Managing coasts with natural solutions: guidelines for measuring and valuing the coastal protection services of mangroves and coral reefs (English). Waves technical paper_. _Washington DC:
The World Bank_ (2016). * Arnell, N. W. Expected annual damages and uncertainties in flood frequency estimation. _J. Water Resour. Plan. Manag._ 115, 94–107 (1989). Article Google Scholar
* Barbier, E. B. Valuing the storm protection service of estuarine and coastal ecosystems. _Ecosyst. Serv._ 11, 32–38 (2015). Article Google Scholar * Barbier, E. B. Valuing ecosystem
services as productive inputs. _Econ. Policy_ 22, 178–229 (2007). Article Google Scholar * Barbier, E. B. The protective service of mangrove ecosystems: A review of valuation methods.
_Mar. Pollut. Bull._ 109, 676–681 (2016). Article CAS PubMed Google Scholar * Koch, E. W. _et al_. Non‐linearity in ecosystem services: temporal and spatial variability in coastal
protection. _Front. Ecol. Environ._ 7, 29–37 (2009). Article Google Scholar * McIvor, A., Spencer, T., Spalding, M., Lacambra, C. & Möller, I. Mangroves, tropical cyclones, and coastal
hazard risk reduction. _Coastal and marine hazards, risks, and disasters_ 403–429 (Elsevier, 2015). * Losada, Í. J. _et al_. Valuing Protective Services of Mangroves in the Philippines.
World Bank (2017). * Muis, S., Verlaan, M., Winsemius, H. C., Aerts, J. C. J. H. & Ward, P. J. A global reanalysis of storm surges and extreme sea levels. _Nat. Commun_. 7 (2016). *
Beck, M. W., Pfliegner, K. & Quast, O. Ecosystem-based Adaptation and Insurance: Success, Challenges and Opportunities. InsuResilience Secretariat, Bonn, Germany (2019). * Narayan, S.
_et al_. The Value of Coastal Wetlands for Flood Damage Reduction in the Northeastern USA. _Sci. Rep._ 7, 1–12 (2017). Article ADS CAS Google Scholar * World Bank. _Forces of nature:
assessment and economic valuation of coastal protection services provided by mangroves in Jamaica_. (2019). * Reguero, B. G. _et al_. Financing coastal resilience by combining nature-based
risk reduction with insurance. _Ecol. Econ_. 169 (2020). Article Google Scholar * Reguero, B. G. _et al_. The risk reduction benefits of the mesoamerican reef in Mexico. _Front. Earth
Sci._ 7, 1–21 (2019). Article Google Scholar * Brown, G. _et al_. Global estimates of the value of ecosystems and their services in monetary units. _Ecosyst. Serv._ 1, 50–61 (2012).
Article Google Scholar * Pascal, N. _et al_. Economic valuation of coral reef ecosystem service of coastal protection: A pragmatic approach. _Ecosyst. Serv._ 21, 72–80 (2016). Article
Google Scholar * van Zanten, B. T., van Beukering, P. J. H. & Wagtendonk, A. J. Coastal protection by coral reefs: A framework for spatial assessment and economic valuation. _Ocean
Coast. Manag._ 96, 94–103 (2014). Article Google Scholar * Knapp, K. R., Kruk, M. C., Levinson, D. H., Diamond, H. J. & Neumann, C. J. The international best track archive for climate
stewardship (IBTrACS) unifying tropical cyclone data. _Bull. Am. Meteorol. Soc._ 91, 363–376 (2010). Article ADS Google Scholar * Huizinga, J., De Moel, H. & Szewczyk, W. _Global
flood depth-damage functions - Methodology and the database with guidelines_., https://doi.org/10.2760/16510 (2017). * Reguero, B. G., Menéndez, M., Méndez, F. J., Mínguez, R. & Losada,
I. J. A Global Ocean Wave (GOW) calibrated reanalysis from 1948 onwards. _Coast. Eng._ 65, 38–55 (2012). Article Google Scholar * Perez, J., Menendez, M. & Losada, I. J. GOW2: A global
wave hindcast for coastal applications. _Coast. Eng._ 124, 1–11 (2017). Article Google Scholar * Cid, A., Camus, P., Castanedo, S., Méndez, F. J. & Medina, R. Global reconstructed
daily surge levels from the 20th Century Reanalysis (1871–2010). _Glob. Planet. Change_ 148, 9–21 (2017). Article ADS Google Scholar * National Economic and Development Authority.
Philippine Development Plan 2017–2022. 1–452 (2017). * Giri, C. _et al_. Status and distribution of mangrove forests of the world using earth observation satellite data. _Glob. Ecol.
Biogeogr._ 20, 154–159 (2011). Article Google Scholar * Delft3D-FLOW user manual. _Delft, the Netherlands_ (2006). * Delft3D-WAVE user manual. _Delft, the Netherlands_ (2000). * Sheppard,
C., Dixon, D. J., Gourlay, M., Sheppard, A. & Payet, R. Coral mortality increases wave energy reaching shores protected by reef flats: Examples from the Seychelles. _Estuar. Coast. Shelf
Sci._ 64, 223–234 (2005). Article ADS Google Scholar * Zhang, K. _et al_. The role of mangroves in attenuating storm surges. _Estuar. Coast. Shelf Sci._ 102–103, 11–23 (2012). Article
ADS Google Scholar * Prager, E. J. Numerical simulation of circulation in a Caribbean-type backreef lagoon - A preliminary study. _Coral Reefs_ 10, 177–182 (1991). Article ADS Google
Scholar * Pawlowicz, R., Beardsley, B. & Lentz, S. Classical tidal harmonic analysis including error estimates in MATLAB using TDE. _Comput. Geosci._ 28, 929–937 (2002). Article ADS
Google Scholar * Egbert, G. D. & Erofeeva, S. Y. Efficient inverse modeling of barotropic ocean tides. _J. Atmos. Ocean. Technol._ 19, 183–204 (2002). Article ADS Google Scholar *
Church, J. A., White, N. J., Coleman, R., Lambeck, K. & Mitrovica, J. X. Estimates of the regional distribution of sea level rise over the 1950–2000 period. _J. Clim._ 17, 2609–2625
(2004). Article ADS Google Scholar * Camus, P., Mendez, F. J. & Medina, R. A hybrid efficient method to downscale wave climate to coastal areas. _Coast. Eng._ 58, 851–862 (2011).
Article Google Scholar * Camus, P., Mendez, F. J., Medina, R. & Cofiño, A. S. Analysis of clustering and selection algorithms for the study of multivariate wave climate. _Coast. Eng._
58, 453–462 (2011). Article Google Scholar * Camus, P., Mendez, F. J., Medina, R., Tomas, A. & Izaguirre, C. High resolution downscaled ocean waves (DOW) reanalysis in coastal areas.
_Coast. Eng._ 72, 56–68 (2013). Article Google Scholar * Lhomme, J. _et al_. Recent development and application of a rapid flood spreading method. (2008). Chapter Google Scholar *
Toimil, A., Losada, I. J., Díaz-Simal, P., Izaguirre, C. & Camus, P. Multi-sectoral, high-resolution assessment of climate change consequences of coastal flooding. 431–444,
https://doi.org/10.1007/s10584-017-2104-z (2017). Article ADS Google Scholar * Farr, T. G. _et al_. The Shuttle Radar Topography Mission. 1–33, https://doi.org/10.1029/2005RG000183
(2007). * Bono, A. D. & Mora, M. G. International Journal of Disaster Risk Reduction A global exposure model for disaster risk assessment. _Int. J. Disaster Risk Reduct._ 10, 442–451
(2014). Article Google Scholar * Beck, M. W. _et al_. _The Global Value of Mangroves for Risk Reduction_. _Summary Report_., https://doi.org/10.7291/V9930RBC (2018). Download references
ACKNOWLEDGEMENTS We thank the supporting provided by the World Bank and the Federal Ministry for the Environment, Nature Conservation and Nuclear Safety (BMU) on the basis of a decision
adopted by the German Bundestag. We also acknowledge financial support from the Spanish Ministry of Economy and Innovation (BIA2014-59718-R). Authors are grateful to the useful contributions
provided by Borja González Reguero (University of Santa Cruz California), Antonio Espejo, Sheila Abad and Pedro Díaz Simal (IH Cantabria). Pelayo Menéndez acknowledge to the FPI grant from
the Spanish Ministry of Economy and Innovation (BES-2015-074343). The authors acknowledge to the National Plan “_RISKOADAPT_” from the Spanish Ministry of Sciences, Innovation and
Universities (BIA2017-89401-R). AUTHOR INFORMATION AUTHORS AND AFFILIATIONS * IHCantabria - Instituto de Hidráulica Ambiental de la Universidad de Cantabria, 39011, Santander, Spain Pelayo
Menéndez, Iñigo J. Losada & Saul Torres-Ortega * Institute of Marine Sciences, University California, Santa Cruz, CA, 95062, USA Pelayo Menéndez, Siddharth Narayan & Michael W. Beck
* The Nature Conservancy, Santa Cruz, CA, 95062, USA Michael W. Beck * Department of Coastal Studies, East Carolina University, 850-NC 345, Wanchese, NC, 27959, USA Siddharth Narayan Authors
* Pelayo Menéndez View author publications You can also search for this author inPubMed Google Scholar * Iñigo J. Losada View author publications You can also search for this author
inPubMed Google Scholar * Saul Torres-Ortega View author publications You can also search for this author inPubMed Google Scholar * Siddharth Narayan View author publications You can also
search for this author inPubMed Google Scholar * Michael W. Beck View author publications You can also search for this author inPubMed Google Scholar CONTRIBUTIONS Conceptualization: Pelayo
Menendez, Iñigo J. Losada, Michael W. Beck. Formal analysis: Pelayo Menendez, Saul Torres-Ortega, Siddharth Narayan. Methodology: Pelayo Menendez, Iñigo J. Losada. Writing-original draft
preparation: Pelayo Menendez, Iñigo J. Losada, Michael W. Beck. Writing, review and editing: Pelayo Menendez, Iñigo J. Losada, Siddharth Narayan, Michael W. Beck. Software: Pelayo Menendez,
Saul Torres-Ortega. Resources: Saul Torres-Ortega, Siddharth Narayan, Michael W. Beck. CORRESPONDING AUTHOR Correspondence to Pelayo Menéndez. ETHICS DECLARATIONS COMPETING INTERESTS The
authors declare no competing interests. ADDITIONAL INFORMATION PUBLISHER’S NOTE Springer Nature remains neutral with regard to jurisdictional claims in published maps and institutional
affiliations. SUPPLEMENTARY INFORMATION SUPPLEMENTARY INFORMATION. RIGHTS AND PERMISSIONS OPEN ACCESS This article is licensed under a Creative Commons Attribution 4.0 International License,
which permits use, sharing, adaptation, distribution and reproduction in any medium or format, as long as you give appropriate credit to the original author(s) and the source, provide a
link to the Creative Commons license, and indicate if changes were made. The images or other third party material in this article are included in the article’s Creative Commons license,
unless indicated otherwise in a credit line to the material. If material is not included in the article’s Creative Commons license and your intended use is not permitted by statutory
regulation or exceeds the permitted use, you will need to obtain permission directly from the copyright holder. To view a copy of this license, visit
http://creativecommons.org/licenses/by/4.0/. Reprints and permissions ABOUT THIS ARTICLE CITE THIS ARTICLE Menéndez, P., Losada, I.J., Torres-Ortega, S. _et al._ The Global Flood Protection
Benefits of Mangroves. _Sci Rep_ 10, 4404 (2020). https://doi.org/10.1038/s41598-020-61136-6 Download citation * Received: 03 December 2019 * Accepted: 17 February 2020 * Published: 10 March
2020 * DOI: https://doi.org/10.1038/s41598-020-61136-6 SHARE THIS ARTICLE Anyone you share the following link with will be able to read this content: Get shareable link Sorry, a shareable
link is not currently available for this article. Copy to clipboard Provided by the Springer Nature SharedIt content-sharing initiative
Trending News
Dwp rolling out major change for people on benefits born within 3-year periodTHE WORK AND PENSIONS SECRETARY, LIZ KENDALL, HAS UNVEILED A £45 MILLION YOUTH GUARANTEE SCHEME. 06:03, 29 May 2025 The ...
Atlanta city council president doug shipman names committee chairs - saportareportBy Maria Saporta Perhaps the most important job of the president of the Atlanta City Council is to select the members to...
Queen heartbreak: cousin opens up over monarch's painPrince Philip was the reliable patriarch of the Royal Family and will be truly missed, the Queen's third cousin Pri...
Aarp i heart caregivers: mark from ohio1467259200 OH Mark FROM OHIO My name is Mark and I have a sister that's nothing less than amazing! ???????? To star...
Vw golf sv gt: practical, but sadly a bit boringThey might not be the most exciting cars, though the flagship hot R version is superb, but generally they represent good...
Latests News
The global flood protection benefits of mangrovesABSTRACT Coastal flood risks are rising rapidly. We provide high resolution estimates of the economic value of mangroves...
Labour mp blasted by radio host as he fails to clarify party planThe Times Radio host confronted the Labour frontbencher on the latest announcement from Chancellor Rishi Sunak suggestin...
Ashlee simpson-ross and evan ross on their new reality show and unisex zadig & voltaire collectionIf the couple who creates together stays together, then husband-wife duo Evan Ross and Ashlee Simpson-Ross are pop-rock ...
Health services | va martinsburg health care | veterans affairsThe Martinsburg VA Medical Center offers a wide range of health, support, and facility services for Veterans at 8 locati...
Fluid-enhanced surface diffusion controls intraparticle phase transformationsABSTRACT Phase transformations driven by compositional change require mass flux across a phase boundary. In some anisotr...