Super-resolved spatial transcriptomics by deep data fusion
Super-resolved spatial transcriptomics by deep data fusion"
- Select a language for the TTS:
- UK English Female
- UK English Male
- US English Female
- US English Male
- Australian Female
- Australian Male
- Language selected: (auto detect) - EN
Play all audios:
Brief Communication Published: 29 November 2021 Super-resolved spatial transcriptomics by deep data fusion Ludvig Bergenstråhle ORCID: orcid.org/0000-0002-5108-44811, Bryan He ORCID:
orcid.org/0000-0002-6150-761X2, Joseph Bergenstråhle1, Xesús Abalo ORCID: orcid.org/0000-0002-1643-07051, Reza Mirzazadeh1, Kim Thrane1, Andrew L. Ji ORCID: orcid.org/0000-0001-9688-56803,
Alma Andersson1, Ludvig Larsson ORCID: orcid.org/0000-0003-4209-29111, Nathalie Stakenborg ORCID: orcid.org/0000-0002-6229-00454, Guy Boeckxstaens4, Paul Khavari ORCID:
orcid.org/0000-0003-0098-49893, James Zou ORCID: orcid.org/0000-0001-8880-47642, Joakim Lundeberg ORCID: orcid.org/0000-0003-4313-16011 & …Jonas Maaskola1,5 Show authors Nature
Biotechnology volume 40, pages 476–479 (2022)Cite this article
27k Accesses
67 Altmetric
Metrics details
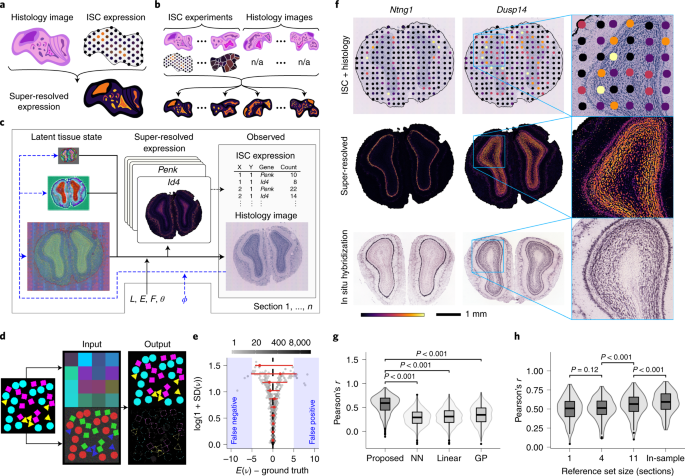
Subjects Data integrationGene expressionMachine learning AbstractCurrent methods for spatial transcriptomics are limited by low spatial resolution. Here we introduce a method that integrates spatial gene expression data with histological image data from
the same tissue section to infer higher-resolution expression maps. Using a deep generative model, our method characterizes the transcriptome of micrometer-scale anatomical features and can
predict spatial gene expression from histology images alone.
Access through your institution Buy or subscribe This is a preview of subscription content, access via your institution
Access options Access through your institution Additional accessoptions: Log in Learn about institutional subscriptions Read our FAQs Contact customer support Fig. 1: Overview and performance evaluation.Fig. 2: Characterization of the transcriptome in
micrometer-scale anatomical features. Similar content being viewed by others Inferring super-resolution tissue architecture by integrating spatial transcriptomics with histology Article 02
January 2024 Integrating spatial and single-cell transcriptomics data using deep generative models with SpatialScope Article Open access 29 November 2023 Integrating spatial gene expression
and breast tumour morphology via deep learning Article 22 June 2020 Data availability
The mouse olfactory bulb dataset was obtained from the Spatial Research group’s website: https://www.spatialresearch.org/resources-published-datasets/doi-10-1126science-aaf2403. The breast
cancer spatial transcriptomics dataset was obtained from the 10x Genomics data repository: https://support.10xgenomics.com/spatial-gene-expression/datasets/. The breast cancer single-cell
dataset was obtained from the authors of the original publication24. The squamous cell carcinoma dataset is available on Mendeley Data: https://doi.org/10.17632/2bh5fchcv6.1. The small
intestine dataset is available on Mendeley Data: https://doi.org/10.17632/v8s9nz948s.1 (folder V19T26-028_B1).
Code availabilityWe have implemented the proposed method in PyTorch39 and the Pyro probabilistic programming language40. The code is available under the MIT license at https://github.com/ludvb/xfuse.
References Ke, R. et al. In situ sequencing for RNA analysis in preserved tissue and cells. Nat. Methods 10, 857–860 (2013).
Article CAS PubMed Google Scholar
Lee, J. H. et al. Highly multiplexed subcellular RNA sequencing in situ. Science 343, 1360–1363 (2014).
Article CAS PubMed PubMed Central Google Scholar
Femino, A. M. Visualization of single RNA transcripts in situ. Science 280, 585–590 (1998).
Article CAS PubMed Google Scholar
Chen, K. H., Boettiger, A. N., Moffitt, J. R., Wang, S. & Zhuang, X. Spatially resolved, highly multiplexed RNA profiling in single cells. Science 348, aaa6090 (2015).
Article PubMed PubMed Central Google Scholar
Eng, C.-H. L. et al. Transcriptome-scale super-resolved imaging in tissues by RNA seqFISH+. Nature 568, 235–239 (2019).
Article CAS PubMed PubMed Central Google Scholar
Ståhl, P. L. et al. Visualization and analysis of gene expression in tissue sections by spatial transcriptomics. Science 353, 78–82 (2016).
Article PubMed Google Scholar
Rodriques, S. G. et al. Slide-seq: a scalable technology for measuring genome-wide expression at high spatial resolution. Science 363, 1463–1467 (2019).
Article CAS PubMed PubMed Central Google Scholar
Vickovic, S. et al. High-definition spatial transcriptomics for in situ tissue profiling. Nat. Methods 16, 987–990 (2019).
Article CAS PubMed PubMed Central Google Scholar
Kingma, D. P. & Welling, M. Auto-encoding variational Bayes. In 2nd International Conference on Learning Representations (eds Bengio, Y. & LeCun, Y.) http://arxiv.org/abs/1312.6114 (2014).
Rezende, D. J., Mohamed, S. & Wierstra, D. Stochastic backpropagation and approximate inference in deep generative models. In Proceedings of the 31th International Conference on Machine
Learning http://proceedings.mlr.press/v32/rezende14.html (2014).
Lein, E. S. et al. Genome-wide atlas of gene expression in the adult mouse brain. Nature 445, 168–176 (2006).
Article PubMed Google Scholar
Uhlen, M. et al. Tissue-based map of the human proteome. Science 347, 1260419 (2015).
Article PubMed Google Scholar
Tepe, B. et al. Single-cell RNA-seq of mouse olfactory bulb reveals cellular heterogeneity and activity-dependent molecular census of adult-born neurons. Cell Rep. 25, 2689–2703 (2018).
Article Google Scholar
Butler, A., Hoffman, P., Smibert, P., Papalexi, E. & Satija, R. Integrating single-cell transcriptomic data across different conditions, technologies, and species. Nat. Biotechnol. 36,
411–420 (2018).
Article CAS PubMed PubMed Central Google Scholar
Bulla, R. et al. C1q acts in the tumour microenvironment as a cancer-promoting factor independently of complement activation. Nat. Commun. 7, 10346 (2016).
Article CAS PubMed PubMed Central Google Scholar
Metodieva, G. et al. CD74-dependent deregulation of the tumor suppressor scribble in human epithelial and breast cancer cells. Neoplasia 15, 660–668 (2013).
Article CAS PubMed PubMed Central Google Scholar
Love, M. I., Huber, W. & Anders, S. Moderated estimation of fold change and dispersion for RNA-seq data with DESeq2. Genome Biol. 15, 550 (2014).
Article PubMed PubMed Central Google Scholar
Blei, D. M., Kucukelbir, A. & McAuliffe, J. D. Variational inference: a review for statisticians. J. Am. Stat. Assoc.112, 859–877 (2017).
Lopez, R., Regier, J., Cole, M. B., Jordan, M. I. & Yosef, N. Deep generative modeling for single-cell transcriptomics. Nat. Methods 15, 1053–1058 (2018).
Article CAS PubMed PubMed Central Google Scholar
Eraslan, G., Simon, L. M., Mircea, M., Mueller, N. S. & Theis, F. J. Single-cell RNA-seq denoising using a deep count autoencoder. Nat. Commun. 10, 390 (2019).
Kingma, D. P. & Ba, J. Adam: a method for stochastic optimization. In 3rd International Conference on Learning Representations (eds Bengio, Y. & LeCun, Y.) http://arxiv.org/abs/1412.6980
(2015).
Ronneberger, O., Fischer, P. & Brox, T. U-Net: Convolutional Networks for Biomedical Image Segmentation 234–241. (Springer, 2015).
Gardner, J. R., Pleiss, G., Bindel, D., Weinberger, K. Q. & Wilson, A. G. GPyTorch: blackbox matrix–matrix Gaussian process inference with GPU acceleration. In Proceedings of the 32nd
International Conference on Neural Information Processing Systems (Curran Associates, 2018).
Wu, S. Z. et al. A single-cell and spatially resolved atlas of human breast cancers. Nat. Genetics 53, 1334–1347 (2021).
Article CAS PubMed Google Scholar
Ji, A. L. et al. Multimodal analysis of composition and spatial architecture in human squamous cell carcinoma. Cell 182, 497–514 (2020).
Article Google Scholar
Macenko, M. et al. A method for normalizing histology slides for quantitative analysis. 2009 IEEE International Symposium on Biomedical Imaging: From Nano to Macro
https://ieeexplore.ieee.org/document/51932500.1109/ISBI.2009.5193250 (2009).
Svensson, V., Teichmann, S. A. & Stegle, O. SpatialDE: identification of spatially variable genes. Nat. Methods 15, 343–346 (2018).
Article CAS PubMed PubMed Central Google Scholar
Sun, S., Zhu, J. & Zhou, X. Statistical analysis of spatial expression patterns for spatially resolved transcriptomic studies. Nat. Methods 17, 193–200 (2020).
Article CAS PubMed PubMed Central Google Scholar
Nitzan, M., Karaiskos, N., Friedman, N. & Rajewsky, N. Gene expression cartography. Nature 576, 132–137 (2019).
Article CAS PubMed Google Scholar
Achim, K. et al. High-throughput spatial mapping of single-cell RNA-seq data to tissue of origin. Nat. Biotechnol. 33, 503–509 (2015).
Article CAS PubMed Google Scholar
Satija, R., Farrell, J. A., Gennert, D., Schier, A. F. & Regev, A. Spatial reconstruction of single-cell gene expression data. Nat. Biotechnol. 33, 495–502 (2015).
Article CAS PubMed PubMed Central Google Scholar
Qian, X. et al. Probabilistic cell typing enables fine mapping of closely related cell types in situ. Nat. Methods 17, 101–106 (2019).
Article PubMed PubMed Central Google Scholar
Lopez, R. et al. A joint model of unpaired data from scRNA-seq and spatial transcriptomics for imputing missing gene expression measurements. In ICML Workshop on Computational Biology
(2019).
Cable, D. M. et al. Robust decomposition of cell type mixtures in spatial transcriptomics. Nat. Biotechnol. https://doi.org/10.1038/s41587-021-00830-w (2021).
Andersson, A. et al. Single-cell and spatial transcriptomics enables probabilistic inference of cell type topography. Commun. Biol. 3, 565 (2020).
Article PubMed PubMed Central Google Scholar
Elosua-Bayes, M., Nieto, P., Mereu, E., Gut, I. & Heyn, H. Spotlight: seeded Nmf regression to deconvolute spatial transcriptomics spots with single-cell transcriptomes. Nucleic Acids Res.
49, e50 (2021).
Article CAS PubMed PubMed Central Google Scholar
Stickels, R. R. et al. Highly sensitive spatial transcriptomics at near-cellular resolution with Slide-seqV2. Nat. Biotechnol. 39, 313–319 (2020).
Article PubMed PubMed Central Google Scholar
Liu, Y. et al. High-spatial-resolution multi-omics sequencing via deterministic barcoding in tissue. Cell 183, 1665-1681 (2020).
Google Scholar
Paszke, A. et al. PyTorch: an imperative style, high-performance deep learning library. In Advances in Neural Information Processing Systems 32 (eds Wallach, H. et al.) 8024–8035
http://papers.neurips.cc/paper/9015-pytorch-an-imperative-style-high-performance-deep-learning-library.pdf (Curran Associates, 2019).
Bingham, E. et al. Pyro: deep universal probabilistic programming. J. Mach. Learn. Res. 20, 1–6 (2019).
Google Scholar
Download references
AcknowledgementsThis work was made possible by generous support from the Knut and Alice Wallenberg Foundation, the Erling-Persson Family Foundation, the Swedish Cancer Society, the Swedish Foundation for
Strategic Research, the Swedish Research Council and the Helmsley Charitable Trust.
Author informationAuthors and Affiliations SciLifeLab, Department of Gene Technology, KTH Royal Institute of Technology, Stockholm, Sweden
Ludvig Bergenstråhle, Joseph Bergenstråhle, Xesús Abalo, Reza Mirzazadeh, Kim Thrane, Alma Andersson, Ludvig Larsson, Joakim Lundeberg & Jonas Maaskola
Department of Biomedical Data Science, Stanford University, Stanford, CA, USA
Bryan He & James Zou
Stanford Cancer Institute, Stanford University, Stanford, CA, USA
Andrew L. Ji & Paul Khavari
Department of Chronic Diseases and Metabolism, Katholieke Universiteit te Leuven, Leuven, Belgium
Nathalie Stakenborg & Guy Boeckxstaens
SciLifeLab, Department of Biochemistry and Biophysics, Stockholm University, Stockholm, Sweden
Jonas Maaskola
AuthorsLudvig BergenstråhleView author publications You can also search for this author inPubMed Google Scholar
Bryan HeView author publications You can also search for this author inPubMed Google Scholar
Joseph BergenstråhleView author publications You can also search for this author inPubMed Google Scholar
Xesús AbaloView author publications You can also search for this author inPubMed Google Scholar
Reza MirzazadehView author publications You can also search for this author inPubMed Google Scholar
Kim ThraneView author publications You can also search for this author inPubMed Google Scholar
Andrew L. JiView author publications You can also search for this author inPubMed Google Scholar
Alma AnderssonView author publications You can also search for this author inPubMed Google Scholar
Ludvig LarssonView author publications You can also search for this author inPubMed Google Scholar
Nathalie StakenborgView author publications You can also search for this author inPubMed Google Scholar
Guy BoeckxstaensView author publications You can also search for this author inPubMed Google Scholar
Paul KhavariView author publications You can also search for this author inPubMed Google Scholar
James ZouView author publications You can also search for this author inPubMed Google Scholar
Joakim LundebergView author publications You can also search for this author inPubMed Google Scholar
Jonas MaaskolaView author publications You can also search for this author inPubMed Google Scholar
ContributionsL.B. and J.M. designed the method and wrote the paper. B.H., J.B., A.A. and A.L.J. provided valuable feedback and contributed to the analyses. R.M., X.A., K.T., L.L. and N.S. performed the
experiments. J.M., J.L., J.Z., P.K. and G.B. supervised the project.
Corresponding author Correspondence to Joakim Lundeberg.
Ethics declarations Competing interestsJ.L., R.M., K.T., A.A. and L.L. are scientific consultants for 10x Genomics, which produces spatially barcoded microarrays for in situ RNA capturing. The remaining authors declare no
competing interests.
Additional informationPeer review information Nature Biotechnology thanks the anonymous reviewers for their contribution to the peer review of this work.
Publisher’s note Springer Nature remains neutral with regard to jurisdictional claims in published maps and institutional affiliations.
Extended dataExtended Data Fig. 1 Deconvolutionexperiments.
a–c, Synthetic data. Receiver operating characteristic (ROC) curves for pixel-level classification of the three transcriptional subtypes: blue circle (a), red square (b), and yellow triangle
(c). Dashed lines show baselines constructed by predicting the observed pixel-average in each measurement location. Ribbons indicate minima and maxima over predictions in 10 random
synthetic image patches. d–f, Biological data. d, The ground truth expression data is downsampled by merging neighboring measurement locations and summing their count values XA + XB = X. The
model is trained on the downsampled data X and used to predict the component counts XA and XB for each gene. e, Predicted direction against ground truth for observations with a 95%
credibility of one component having a strictly higher expression than the other. Points show the medians of the predictive distributions, and error bars indicate 90% credibility intervals.
Colors indicate if the predicted direction is the same as the ground truth direction. The dashed line indicates identity. For readability, points are only shown for the 10 highest-expressed
genes. Hexagonal bins show observations for all genes (n = 12 776). Statistics are based on all genes. f, Directional misprediction against prediction uncertainty. In red, points indicate
the 50th and error bars the 5th and 95th percentiles in evenly distributed bins.
Extended Data Fig. 2 Comparison of inferred super-resolved expression maps to in situ hybridizationreference data.
Random samples from the 1000 highest-expressed genes. Raw: Raw expression data (Voronoi tesselation). Inferred: Inferred super-resolved expression maps. ISH: In situ hybridization reference
data from the Allen Mouse Brain Atlas11. Images show a representative sample of the 12 mouse olfactory bulb sections in the dataset.
Extended Data Fig. 3 Prediction of spatial geneexpression from histology images, mouse olfactory bulb experiments.
a, Histology image of holdout section (hematoxylin and eosin stain). b, Summarized expression map of the predicted metagene expression in the holdout section. c, Comparison of summarized
expression maps constructed from normalized log ground truth gene expression in the held-out section (top) and normalized log predicted gene expression at the ground truth measurement
locations using data from b (bottom). Results are based on an analysis that uses the 12th sample as holdout section (shown in a–c) and the remaining 11 samples as reference
experiments.
Extended Data Fig. 4 Prediction of spatial gene expression from histology images, squamous cell carcinoma experiments.The dataset consists of four serial tissue sections spaced 150 μm apart. The outer sections A and D are used as reference experiments to predict expression in the intermediate holdout
sections B and C. a, Top: Histological image data (hematoxylin and eosin stains). Middle: Predicted summarized expression maps. Bottom: Predicted expression against ground truth for all
genes (n = 11 025) in 100 randomly sampled test locations. b,c, Baseline experiments. b, Constant prediction against ground truth for all genes in the same test locations as in (a). For each
gene, the prediction is the mean expression in sections A and D. c, Image intensity-based linear regression prediction against ground truth for all genes in the same test locations as in
(a). The expression Xlg of gene g in location l is modeled as \({X}_{lg}={\beta }_{g}^{0}+{\beta }_{g}{I}_{l}+{\epsilon }_{lg}\), where Il is a vector of the channel-wise 5-binned image
intensities of location l and ϵlg a standard normal noise term. The parameters \({\beta }_{g}^{0}\) and βg are selected by maximum likelihood estimation with data from sections A and D.
Predictions are given by \({X}_{lg}^{* }=\max (0,\beta^0_g+{\beta }_{g}{I}_{l})\). d, Stability to variation in staining intensities. Left: Evaluated hematoxylin (H) and eosin (E)
concentrations. Mixes are produced synthetically by rescaling the H and E channels (Methods). Images show representative close-ups from one of the four sections in the dataset. Right:
Gene-wise Pearson correlation over all test locations in each holdout section evaluated on the n = 100 highest-expressed genes. Boxes show 25th, 50th, and 75th percentiles. Outliers are
represented by points and defined as observations further than 1.5 interquartile ranges from the hinges. Whiskers indicate the extent of all non-outlier observations.
Extended Data Fig. 5Run-to-run variability.
Results are based on four restarts of an analysis of the ileum of the human small intestine. a, Correlation plots. Each plot shows the predicted mean count for every gene in 100 test regions
in two different runs. The test regions are sampled uniformly over the tissue surface and have the same size as the measurement locations in the original dataset. Correlation coefficients
are computed over all genes and test locations (n = 6869 × 100 = 686 900). b, Differences in predicted means E[νi] − E[νj] against prediction uncertainty \(\sqrt{V({\nu }_{i})+V({\nu
}_{j})}\) for runs i and j. In red, points indicate the 50th and error bars the 5th and 95th percentiles in evenly distributed bins.
Extended Data Fig. 6 Robustness to measurementlocation misalignment.
a, Hematoxylin and eosin stain of a section from the ileum of the human small intestine. Representative close-up of a small area of the brush border. The brush border in the section measures
approximately 7 mm in length. b, Conceptual illustration of the measurement locations on the Visium array. Dark circles indicate test locations withheld during training. Light circles
indicate training locations over three misalignment levels: 0.0 (light green), 1.0 (green), and 2.0 (blue) radii of the measurement locations (r = 55 μm). The direction of the misalignment
is uniformly random. c,d, Gene-wise Pearson correlation between predicted and ground truth expression (c) and coefficient of determination (d) over the test locations of the n = 100
highest-expressed genes for increasing offsets. Boxes show 25th, 50th, and 75th percentiles. Outliers are represented by points and defined as observations further than 1.5 interquartile
ranges from the hinges. Whiskers indicate the extent of all non-outlier observations. Pairwise p-values are based two-sided Wilcoxon signed-rank tests. Exact p-values (top to bottom): c,
2.98 × 10⁻⁷ and 8.30 × 10⁻¹; d, 3.45 × 10⁻⁹ and 8.14 × 10⁻¹. e–g, Predicted expression of CDHR5 when the training set has 0.0 (e), 1.0 (f), or 2.0 (g) radii misalignment. Close-ups of the
same area as in a. h, Reference antibody staining for CDHR5 in the small intestine from the Human Protein Atlas12.
Extended Data Fig. 7 Robustness to image disruptions.a, Hematoxylin and eosin stains of a section from the ileum of the human small intestine with increasing levels of occlusion noise (ε). Representative close-ups of the smooth muscle layers.
The smooth muscle layers in the section measure approximately 3 × 5 mm2. Noise is added by randomly sampling a proportion ε of tiles from a 100 × 100 grid covering the histology image and
replacing them with the mean color intensity of the slide. b, Conceptual illustration of the measurement locations on the Visium array. The locations are divided into a training (light
green) and test set. The test set is further divided into regions that are fully visible in all experiments (green) and regions that are at least partially occluded in some experiments
(blue). c–h, Performance under different occlusion levels evaluated using the gene-wise Pearson correlation between predicted and ground truth expression (c–e) and coefficient of
determination (f–h) over the test locations of the n = 100 highest-expressed genes. Boxes show 25th, 50th, and 75th percentiles. Outliers are represented by points and defined as
observations further than 1.5 interquartile ranges from the hinges. Whiskers indicate the extent of all nonoutlier observations. Pairwise p-values are based two-sided Wilcoxon signed-rank
tests. Exact p-values (top to bottom): c, 1.48 × 10⁻¹⁷ and 9.18 × 10⁻¹⁸; d, 1.71 × 10⁻¹³ and 3.77 × 10⁻¹³; e, 9.75 × 10⁻¹⁸ and 8.39 × 10⁻¹⁸; f, 8.65 × 10⁻¹⁸ and 5.85 × 10⁻¹⁸; g, 1.15 × 10⁻¹⁶
and 2.24 × 10⁻¹⁵; h, 7.44 × 10⁻¹⁸ and 6.03 × 10⁻¹⁸. i, Prediction of ACTG2, a gene coding for gamma-enteric smooth muscle actin, over different occlusion levels.
Extended Data Fig. 8Differential gene expression and cell-type composition.
a,b, Differential gene expression, mouse olfactory bulb dataset. a, Annotation of the mitral cell layer (MCL). Percentages indicate area overlap with pixel annotation. b, Agreement with MCL
marker reference list13 over different set sizes of genes predicted to be differentially expressed. Genes are ranked by the inverted coefficient of variation of their posterior log fold
change (Super-resolved ST) or p-value (Seurat). Only genes with a predicted positive log fold change are shown. c–e, Cell-type composition, ductal carcinoma in situ (DCIS) dataset. c,
Predicted cell types in each measurement location. Colors correspond to the score-weighted sums of the cell-type labels’ RGB coordinates. d, Measurement-level classification as a function of
proximity to the tumor edge. Bar heights show classification scores across all measurement locations weighted by their overlap with each distance isoline. e, Pixel-level classification as a
function of proximity to the tumor edge. Bar heights show classification scores based on the predicted expression for the pixel band at each distance. Red dashed line: Tumor edge. Black
dotted line: 200 μm isoline.
Extended Data Fig. 9 Architecture.a, Fusion network. b, Image data decoder. c, Expression data decoder. Volume dimensions and number of down- and upsampling steps are exemplative.
Extended Data Fig. 10 Runtime.Normalized ELBO over time for three runs with varying dataset sizes. Vertical lines indicate time points when the runs reached 95% of the maximum attained normalized ELBO for the first
time.
Supplementary informationSupplementary InformationSupplementary Tables 1 and 2.
Reporting Summary.Rights and permissions Reprints and permissions
About this articleCite this article Bergenstråhle, L., He, B., Bergenstråhle, J. et al. Super-resolved spatial transcriptomics by deep data fusion. Nat Biotechnol 40, 476–479 (2022).
https://doi.org/10.1038/s41587-021-01075-3
Download citation
Received: 12 March 2020
Accepted: 27 August 2021
Published: 29 November 2021
Issue Date: April 2022
DOI: https://doi.org/10.1038/s41587-021-01075-3
Share this article Anyone you share the following link with will be able to read this content:
Get shareable link Sorry, a shareable link is not currently available for this article.
Copy to clipboard Provided by the Springer Nature SharedIt content-sharing initiative
Trending News
Horoscopes & love: Gemini urged to think before making potential 'irrevocable decision'Each star sign in the zodiac has different qualities, needs, and desires when it comes to finding love and being in love...
Cramer Interviews PPG Industries' CEOEurope's sovereign debt crisis might be moving markets now, but Cramer on Wednesday said homegamers should direction the...
Royal heartbreak: how prince charles confessed his ‘obsession’Charles has been the heir to the throne since his mother’s ascension to the throne in 1952. His investiture as the Princ...
Fgf19 and fgfr4 promotes the progression of gallbladder carcinoma in an autocrine pathway dependent on gpbar1-camp-egr1 axisABSTRACT Treatment options for gallbladder carcinoma (GBC) are limited and GBC prognosis remains poor. There is no well-...
‘Struck gold!’ How archaeologists made ‘extremely rare royal find’ in SuffolkThe discovery was made possible thanks to Dave Cummings, an amateur archaeologist who used a metal detector to unearth m...
Latests News
Super-resolved spatial transcriptomics by deep data fusionBrief Communication Published: 29 November 2021 Super-resolved spatial transcriptomics by deep data fusion Ludvig Bergen...
Page not foundLoading......
Anne Cole - Los Angeles Times_ Now Showing is an occasional feature that spotlights designers who appear with their collections in local stores. _ An...
Community Care | VA Cheyenne Health Care | Veterans AffairsVA provides care to Veterans through community providers when VA cannot provide the care needed. Community care is based...
The page you were looking for doesn't exist.You may have mistyped the address or the page may have moved.By proceeding, you agree to our Terms & Conditions and our ...