Resolved alma observations of water in the inner astronomical units of the hl tau disk
Resolved alma observations of water in the inner astronomical units of the hl tau disk"
- Select a language for the TTS:
- UK English Female
- UK English Male
- US English Female
- US English Male
- Australian Female
- Australian Male
- Language selected: (auto detect) - EN
Play all audios:
ABSTRACT The water molecule is a key ingredient in the formation of planetary systems, with the water snowline being a favourable location for the growth of massive planetary cores. Here we
present Atacama Large Millimeter/submillimeter Array data of the ringed protoplanetary disk orbiting the young star HL Tauri that show centrally peaked, bright emission arising from three
distinct transitions of the main water isotopologue (\({\mathrm{H}}_{2}^{16}{\mathrm{O}}\)). The spatially and spectrally resolved water content probes gas in a thermal range down to the
water sublimation temperature. Our analysis implies a stringent lower limit of 3.7 Earth oceans of water vapour available within the inner 17 astronomical units of the system. We show that
our observations are limited to probing the water content in the atmosphere of the disk, due to the high dust column density and absorption, and indicate that the main water isotopologue is
the best tracer to spatially resolve water vapour in protoplanetary disks. SIMILAR CONTENT BEING VIEWED BY OTHERS WATER IN THE TERRESTRIAL PLANET-FORMING ZONE OF THE PDS 70 DISK Article Open
access 24 July 2023 DEUTERIUM-ENRICHED WATER TIES PLANET-FORMING DISKS TO COMETS AND PROTOSTARS Article 08 March 2023 OH AS A PROBE OF THE WARM-WATER CYCLE IN PLANET-FORMING DISKS Article
23 February 2024 MAIN The water molecule is undoubtedly one of the most important molecular species in the whole Universe. Being an extremely efficient solvent, water had a key role in the
emergence of life as we know it on our planet. For this reason, the chemical characterization of exoplanetary atmospheres is often focused on detecting this particular molecular
species1,2,3. Formed by the common H and O atoms, water plays a fundamental role in the physics of the formation of planetary systems, due to its very high abundance in both gaseous and icy
forms4,5. Theoretical models predict that at the location of the phase transition from gaseous to solid form, dust grains can accumulate and grow very efficiently, promoting the fast
formation of planetary cores. Across this particular radial location, called the ‘snowline’, grains can drastically change their drift and fragmentation velocity, composition and opacity. In
synergy with vapour radial diffusion6, these physical discontinuities can lead to the accumulation and growth of dust grains into planetesimals7,8. The position of the snowline also defines
the chemistry of the available planet building blocks. Since the H2O molecule is the major elemental oxygen carrier in the disk, its desorption and freezing affect the elemental C/O ratio
in both the gas and solid phases9,10,11. Because of its large binding energy, the H2O transition from ice to gas happens a few astronomical units (au) from the young star where the midplane
temperatures are in the range from 100 to 200 K, making it the last major ice component to sublimate. However, the proximity to the host star makes the detection of the snowline complicated
even in the closest star-forming regions. Both cold and warm water lines have been detected in a few disks by Herschel (see refs. 12,13 and references therein), Spitzer14, JWST15,16,17 and
ground-based observatories18, but the low angular resolution did not allow robust inferences about the extent of the water snowline. Directly observing water emission from the ground is
complicated by the high water vapour content of the Earth’s atmosphere, resulting in strong telluric absorption. To circumvent this problem, most programmes at millimetre wavelengths have
focused on attempting the detection of the rarer \({\mathrm{H}}_{2}^{18}{\mathrm{O}}\) and HDO isotopologues, leading to the clear detection of spatially resolved water isotopologue emission
in the outbursting source V883 Ori (ref. 19). In quiescent sources, except the candidate detections in the AS 205N and HL Tauri (HL Tau) disks, no detection of thermal emission at
(submillimetre) wavelengths has been reported in the literature20,21,22,23. In this Article, we focus on the textbook case of HL Tau, the first protoplanetary disk imaged at very high
angular resolution (~0.025_″_) with the Atacama Large Millimeter/submillimeter Array (ALMA)24. The disk shows a spectacular pattern of concentric rings. With the source being young (≲1 Myr)
and the dynamical stellar mass being relatively high (2.1 ± 0.2 _M_⊙; ref. 25), the inner disk temperatures are expected to be warm, due to irradiation and accretion heating. Warm and hot
water has been detected in HL Tau both by Herschel in the far infrared26 and by ground-based high-resolution spectroscopy in the mid-infrared27, with the lines not being spatially resolved.
With this Article, we report the detection of three rotational water lines in the inner regions of the HL Tau protoplanetary disk obtained with ALMA. The lines are spectrally resolved.
Analysis of the interferometric data confirms that the extent of the water emission is confined within a prominent gap seen in the HL Tau continuum intensity. These data present spatially
resolved images of the emission from the main water isotopologue (H2O) in a protoplanetary disk and pave the way to a new observational strategy to characterize the water vapour content of
terrestrial planet-forming regions. OBSERVATIONS We observed HL Tau in two different ALMA bands (band 5, originally developed with the goal of studying water in the local Universe28, and
band 7) to target three transitions of water (two lines of para-water and one line of ortho-water): p-H2O 313–220 and 515–422, at 183.31 and 325.15 GHz, respectively, and o-H2O 1029–936 at
321.22 GHz. The first two lines are expected to trace warm water vapour outside the water snowline, while the third line is predicted to detect hot water within the water snowline29,30. We
also observed a rotational transition of the water isotopologue p-\({\mathrm{H}}_{2}^{18}{\mathrm{O}}\) at 322.46 GHz. The molecular coefficients of the lines and sensitivity of the
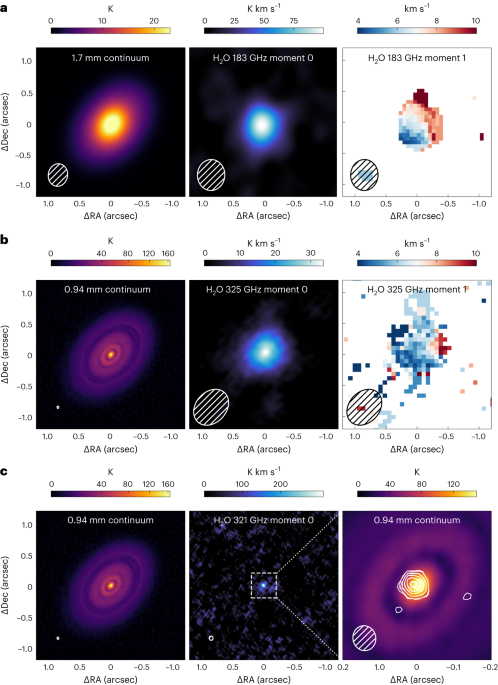
observations are reported in Tables 1 and 2. After self-calibration, we imaged both the continuum and the continuum-subtracted lines with the CASA software31. The continuum images are shown
in Fig. 1. All the H2O lines and the \({\mathrm{H}}_{2}^{18}{\mathrm{O}}\) line were imaged with CASA 6.2.1 with natural weighting, to maximize point source sensitivity. The 183 GHz line
presents a synthesized beam of 0.500″ × 0.442″ (position angle (PA) −3.0°) and was imaged with a channel width of 0.8 km −1. The resulting beam for the 325 GHz water line is 0.640″ × 0.491″
(PA −42.1°), with a 1 km s−1 channel spacing. For the high-excitation 321 GHz line, only one long baselines execution block was available, and the beam is 0.067″ × 0.061″ (PA 12.2°), with a
5 km s−1 channel spacing. The \({\mathrm{H}}_{2}^{18}{\mathrm{O}}\) line was imaged with several different channel spacings. To have a one-to-one comparison with the main isotopologue line,
in this Article we show the results with a channel width of 1 km s−1. The resulting beam is 0.779″ × 0.626″ (PA −46.7°). The spectrum of the two lowest excitation lines was extracted over a
circular area with 0.7″ radius and is shown in Fig. 2. Both the 183 and 325 GHz lines are clearly detected across multiple channels, with the lines being centred on the systemic velocity of
the system (7.1 km s−1; refs. 32,33). The 325 GHz line shows an absorption component at ~10 km s−1, as seen for other lines at similar upper energy levels33. The 183 GHz line shows a width
of ~12 km s−1, while the higher-frequency lines show a slightly broader emission. The 183 GHz line spectrum exhibits a peak signal-to-noise ratio (SNR) of ~9.6, with a root mean square
(r.m.s.) of 13.2 mJy over the flux density extraction area. The 325 GHz line spectrum instead shows a peak SNR of ~5.8, with a r.m.s. of 14.0 mJy. The higher-energy line at 321 GHz does not
show a detection when integrating over the same area, due to the much smaller beam and the resulting high r.m.s. We thus extracted a spectrum over a circular area with radius 0.06″. The peak
SNR is ~4.1, with a r.m.s. of 3.0 mJy. This transition shows the broadest line profile among the three detected lines, consistent with originating from the inner regions with higher
Keplerian velocities. In all cases, the integrated intensity map shows a strong detection with a peak colocated with the dust continuum peak (Fig. 1). We obtain peak SNRs of 21.4, 19.8 and
8.1 in the integrated intensity maps of the 183, 325 and 321 GHz lines, respectively. The line fluxes extracted over a circular area centred on the continuum peak are reported in Table 1.
The intensity-weighted velocity maps (moment 1 maps) of the 183 and 325 GHz lines are shown in Fig. 1. In the high-SNR map of the 183 GHz line, disk rotation is clearly detected, with PA and
systemic velocity in agreement with other brighter lines from the same dataset33, indicating that a displacement of the photocenter of the blue-shifted and red-shifted channels is detected
at the current resolution. For the \({\mathrm{H}}_{2}^{18}{\mathrm{O}}\) line in band 7, we extracted the spectrum with the same methodology described for the three main isotopologue lines,
over a 0.7″ radius circular area (Extended Data Fig. 1). A moment 0 map was computed over the same spectral range as the main isotopologue line. The line was not detected. THE SPATIAL
DISTRIBUTION OF WATER VAPOUR The integrated intensity morphologies of the 183 and 321 GHz lines are remarkably different (Fig. 1), but so are the angular resolutions of the two moment maps.
In order to derive radial profiles of the respective integrated intensities, we used two different approaches. First we focused on the highest-SNR line of the sample (at 183 GHz), which is
also the coldest and therefore expected to trace the largest spatial extent. We averaged in frequency the interferometric data of the continuum-subtracted line in the same frequency range
used to compute the moment 0 map. We then fitted the line integrated intensity visibilities with a simple Gaussian model using the galario package34 after fixing the inclination and PA to
46.7 and 138.0°, respectively, as derived from high-angular-resolution continuum observations24. The fit converges well to a Gaussian with _σ_G = 0.12 ± 0.01″ (Fig. 3 and Extended Data Fig.
2; _σ_G is the standard deviation of the Gaussian function). At a distance of 140 pc, this corresponds to _σ_G = 16.8 ± 1.4 au. For the 321 GHz line; the much higher angular resolution
allowed us to compute the radial profile of the integrated intensity by azimuthally averaging the moment zero map after deprojecting it by the known inclination (using the GoFish package35).
Figure 3 compares the two integrated intensity profiles with the band 7 azimuthally averaged continuum intensity profile. Both line profiles are clearly centrally peaked, indicating that
the water vapour emission must originate above the optically thick continuum from the disk midplane. The lower excitation line is substantially more extended, showing that the water emission
has a radially decreasing temperature (excitation) and that the high-excitation line is not optically thick outside the central beam. The same line shows detectable emission out to 0.3″
when boosting the SNR by azimuthally averaging. The 183 GHz temperature gradient is confirmed by fitting the high-SNR spectrum with a Keplerian disk model with a brightness temperature
gradient, assuming that the line is close to being optically thick (Extended Data Fig. 3). Declining temperature profiles are preferred to flat ones, in agreement with the derived integrated
intensity profile. The warm brightness temperature profile of the 183 GHz line, which far exceeds the midplane temperatures obtained by analysis of multiwavelength continuum data36,
indicates that the water vapour we are tracing originates in the warm disk upper layers. This is further supported by the peak of the 321 GHz emission, which is slightly shifted from the
continuum peak (Fig. 1, bottom-right panel). Even though the two are consistent within the astrometric precision of the data, the apparent shift agrees with tracing water vapour on the side
of the disk closer to the observer, which is in the northeast25, unocculted by the optically thick dust continuum. These findings set a stringent upper limit on the radius of the water
snowline at 17 au. A more accurate determination will require simultaneous forward-modelling of the radial and spectral profiles of all three (sub)millimetre lines with the aid of
thermochemical codes. WATER COLUMN DENSITY From the three main water lines, we computed the rotational diagram, under the assumption of optically thin emission and uniform excitation
temperature across the energy range. While the very inner regions of the line emission are likely opaque, the bulk of the emission from the three lines cannot be optically thick, since this
would imply a flux ratio that is equal to the square of the frequency ratio (in the Rayleigh–Jeans regime and local thermodynamical equilibrium), which we do not observe. While masing cannot
be excluded as partly contributing to the emission, in the high-spectral-resolution spectra of the 183 and 325 GHz lines we have not identified individual narrow spectral features, which
are in general a good signature for maser action together with high flux density. From the high densities of the inner disk, masing is not expected for the three lines analysed here, and the
only contribution could originate in the very upper layers at low volume densities where collisional quenching of the masing action is less probable. In the rotational diagram, we used
degeneracy quantum numbers that account for a 3:1 ortho-to-para ratio, and a partition function that considers all states within the same assumption37. No rescaling of the ortho- and
para-line fluxes is needed to compute the total water column. We accounted for 10% absolute flux systematic uncertainties in the line fluxes. The rotational diagram does not provide a unique
solution for the rotation temperature, as shown in Fig. 4. The Monte Carlo Markov chain (MCMC) exploration individuates two distinct temperatures, which realistically indicate a continuous
gradient in the excitation temperature of the water vapour. Fitting either the two lower-energy lines or the two higher-energy lines separately, the rotational diagram indicates excitation
temperatures of \(21{4}_{-29}^{+42}\) and \(78{9}_{-110}^{+127}\) K, respectively, in line with the two classes of solutions obtained in the joint fit (Extended Data Fig. 4). The
lower-temperature solution is sensitive to colder water vapour in the range of expected desorption temperatures of water ice in space, suggesting that the bulk of the water emission from the
183 GHz line traces water gas in the proximity of the snow surface. The higher-temperature solution is driven by warm gas in the upper layers of the terrestrial planet-forming regions of
the disk, which are well imaged by the high-resolution 321 GHz line integrated intensity map, and likely by the lines being close to be optically thick. The excitation temperature of the
warm gas is in broad agreement with mid-infrared line fluxes in the 12.37–12.41 μm range on the same source (in particular, the o-H2O 164 13–151 14 line with upper state energy _E_up = 4,948
K (ref. 27)). These high temperatures allow for water vapour formed in situ via gas-phase reactions38,39. All the rotational diagrams robustly constrain the column density of water gas (in
the optically thin limit and above the optically thick continuum). The joint fit shows a total water column density \({\log
}_{10}({N}_{{{{\rm{thin}}}}}/{{{{\rm{cm}^2}}}})=16.4{1}_{-0.09}^{+0.06}\) within 0.7″ (~100 au) from the star. This corresponds to ~3.7 Earth oceans (7.1 × 10⁻² lunar masses) of water
vapour. Given the optically thin assumption, this has to be considered a tight lower limit. Since most of the emission originates from ≲0.12″ (17 au), assuming that the entirety of it is
confined within this radial range, we obtain an average column density of \({\log }_{10}({N}_{{{{\rm{thin}}}}}/{{{{\rm{cm}^2}}}})\approx18.1{0}_{-0.09}^{+0.06}\), when accounting for the
disk inclination. The non-detection of the \({\mathrm{H}}_{2}^{18}{\mathrm{O}}\) line can determine an upper limit of the average optical depth expected for the H2O 325 GHz line (\({\tau
}_{{{{{\rm{H}}}}}_{2}{{{\rm{O}}}}}\)). Assuming that \({\tau }_{{{{{\rm{H}}}}}_{2}{{{\rm{O}}}}}=530\,{\tau }_{{{{{\rm{H}}}}}_{2}^{18}{{{\rm{O}}}}}\) (using the oxygen isotope ratio measured
in the solar wind40), we obtain that \({\tau }_{{{{{\rm{H}}}}}_{2}{{{\rm{O}}}}} < 14\). By turning the argument around, the optically thin assumption for the 325 GHz line provides an
upper limit of _N_(H2O)/_N_(\({\mathrm{H}}_{2}^{18}{\mathrm{O}}\)) = 40 in HL Tau, well in agreement with oxygen fractionation levels in our own solar system41. The non-detection of
\({\mathrm{H}}_{2}^{18}{\mathrm{O}}\) shows that observational campaigns aimed at targeting water in inner disks of quiescent disks with ALMA should privilege the main isotopologue as a
first choice, with follow-up observations of robust detections targeting HDO and \({\mathrm{H}}_{2}^{18}{\mathrm{O}}\) to derive more accurate column densities and set stringent limits on
the water deuteration19. Assuming that the bulk of the water emission originates from ≲17 au from the star, we can compare the total mass of water (\({M}_{{{{{\rm{H}}}}}_{2}{{{\rm{O}}}}}\))
to the mass of dust _M_dust estimated from multiwavelength continuum analysis of ALMA and Karl G. Jansky Very Large Array data in the same radial range36. By using the dust surface density
from this study, we obtain _M_dust ≈ 13_M_Earth, which leads to a water-to-dust mass ratio of \({M}_{{{{{\rm{H}}}}}_{2}{{{\rm{O}}}}}/{M}_{{{{\rm{dust}}}}}\approx6\times 1{0}^{-5}\). This
number is much lower than the expected water abundance in inner disks (water-to-dust mass ratio ~10−2). The optical thickness of water can only marginally alleviate the problem, given the
non-detection of \({\mathrm{H}}_{2}^{18}{\mathrm{O}}\). Continuum subtraction could also marginally reduce the water brightness temperature42 but in this case is not expected to reduce the
water fluxes by more than a factor of 2 (see Fig. 3). The low water-to-dust ratio further strengthens the interpretation that with ALMA, we are probing only the upper layers of the disk,
above the optically thick screen of the dust continuum emission, which shows optical depths between ~5 and 10 at 0.9 mm within the inner 17 au (ref. 36). The large cavity seen in the HDO and
\({\mathrm{H}}_{2}^{18}{\mathrm{O}}\) integrated intensity maps of V883 Ori (ref. 19) further supports that the observation of a large column of water is hindered by the optically thick
continuum in the inner disk. CONCLUSIONS These new ALMA data reveal high-significance detections of three distinct rotational transitions of the main isotopologue of water vapour in the
inner regions of the ringed HL Tau disk. These observations pave the way to the characterization of the water content of the inner regions of protoplanetary disks. The tremendous angular
resolution and sensitivity of the ALMA telescope, even in spectral ranges of low atmospheric transmission, are providing spatially and spectrally resolved images of the vapour of the main
water isotopologue in a planet-forming disk. Analyses of the morphology of the water emission, the spectrum of the highest SNR line and the excitation conditions jointly indicate that the
(sub)millimetre lines are probing warm gas in the disk upper layers above the water snow surface, with a radially decreasing temperature profile. The non-detection of
\({\mathrm{H}}_{2}^{18}{\mathrm{O}}\) and the low water-to-dust ratio in the inner 17 au show that the observations are probing marginally optically thick gas above the opaque dust continuum
emission. These results highlight that the water content of quiescent protoplanetary disks at (sub)millimetre wavelengths is most efficiently unveiled by targeting the main isotopologue, in
particular in disks with high-continuum optical depths within the water snowline. METHODS OBSERVATIONS, DATA REDUCTION AND IMAGING HL Tau was observed in both band 5 and band 7 with the
ALMA program 2017.1.01178.S (principal investigator: E.H.), targeting the two para-water lines at 183.31004 and 325.15297 GHz, respectively. HL Tau was also observed in band 7 to target the
latter water line with program 2022.1.00905.S (principal investigator: S.F.), together with the \({\mathrm{H}}_{2}^{18}{\mathrm{O}}\) line at 322.46517 GHz (see Table 1). The molecular
coefficients for the three transitions are reported in Tables 1 and 3. In the 2017.1.01178.S ALMA program, the source was observed in band 5 on 21 September 2018 for a total integration time
of 46 min, with 43 antennas and baselines ranging between 15 m and 1.4 km. The weather conditions during the observation were exceptional, with a median precipitable water vapour (PWV)
column during the observations of ~0.19 mm. J0423-0120 was used as amplitude and bandpass calibrator and J0510+1800 for phase referencing. The band 5 spectral setup had six spectral windows
(SPWs), five of which targeted different molecular transitions, including the 183 GHz water line, and a 1.875-GHz-wide spw for continuum observations at 170.004 GHz. In the same program, HL
Tau was observed in band 7 in two spectral setups. The first was on 12 August 2019 with a time on-source of 31 min, with 48 antennas and baselines ranging between 41 m and 3.6 km. The median
PWV column was 0.4 mm. J0431+1731 was used to cross-calibrate phases, and J0538-4405 for amplitude and spectral response. This first spectral setup consisted of four SPWs in frequency
division mode: three with a maximum bandwidth of 1.875 GHz, and one with 1,920 244 kHz channels, targeting the water 325 GHz line. The second spectral setup was used in the same program with
an execution block observed on 24 November 2017. The median PWV was 0.5 mm. J0519-4546 was used as amplitude and bandpass calibrator, and J0440+1437 as phase calibrator. The observation
spent 33 min on the science target with 49 antennas, with a maximum baseline of 8,500 m. The spectral setup consisted of four SPWs in frequency division mode: three with maximum bandwidth,
and one with 1,920 244 kHz channels, targeting the water 321 GHz line. Finally, new data were taken in October 2022 with a more compact array in band 7 with program 2022.1.00905.S, with
baselines ranging between 15 and 500 m and a total on-source time of 100 min with 41/45 antennas (in two execution blocks). The median PWV column was ~0.3. J0423-0120 was used for flux and
bandpass calibration, while J0431+1731 was used for phase referencing. The setup had four SPWs, one centred on the 325.15 GHz water line and another targeting the
\({\mathrm{H}}_{2}^{18}{\mathrm{O}}\) line at 322.46517 GHz. The cycle 6 (9) data were calibrated by the ALMA pipeline using CASA v.5.4 (v.6.4)31. For the band 7 data, we combined the data
from the two cycles. For both bands, we first self-calibrated each of the three execution blocks in phase, combining all spectral windows after flagging spectral ranges associated to line
emission, and combining all scans. Following ref. 43, we then aligned the data by fitting a Gaussian to the continuum and shifting the phase centre to the continuum maximum with the fixvis
and fixplanet tasks. We then self-calibrated the two short-baseline (in the case of band 5, only one set of baselines is available) execution blocks in both phase and amplitude, reaching a
peak SNR of 9,950 (a ~500% improvement). In the case of band 7, we then combined the long-baseline execution block from the cycle 6 data and self-calibrated the data again in both phase and
amplitude, reaching a peak SNR of 5,300 (a 210% improvement). We took particular care with the amplitude calibration, where the gain solution with scan-length intervals greatly improved the
data quality. The models for self-calibration were constructed with CLEAN with Briggs weighting (robust = 0.5). The gain solutions were then applied to the full spectral data. The band 5
continuum data were imaged with robust = 0.0. With a synthesized beam of 0.364″ × 0.312″ (PA −9.5°), the band 5 (1.70 mm) continuum presents a r.m.s. of 33 μJy, with a peak SNR of 2,457. The
band 7 (0.94 mm) data were imaged with robust = −1.0. The data exhibit a r.m.s. of 36 y, with a peak SNR of 403 over a synthesized beam of 0.037″ × 0.029″ (PA 1.5°). A flux density for both
images was obtained over an elliptical area with a semimajor axis of 1.3″ and semiminor axis and PA to trace the disk inclination and PA (46.7 and 138.0°, respectively24). Without
accounting for absolute flux calibration uncertainties, we obtain a flux density of 323.0 ± 1.4 mJy and 1,677.7 ± 0.6 mJy at 1.70 and 0.94 mm, respectively, where the uncertainties have been
computed as standard deviations of randomly selected masks with the same area of flux density extraction over emission-free regions of the continuum maps. While the water lines have been
imaged with natural weighting (see main text), several additional attempts with a range of UV tapers were performed to increase the sensitivity to extended emission, but they did not show
any feature undetected with natural weighting. Both integrated intensity (moment 0) and intensity-weighted velocity (moment 1) maps were generated for the water lines. Moment 0 maps were
computed by integrating channels between −2 and 16 km s−1 without any clipping (Fig. 1) for the band 5 line, between −6.4 and 20.6 km s−1 for the 325 GHz line and between −10.4 and 24.6 km
s−1 for the 321 GHz line. For the two brighter lines, we integrated the moment 0 maps over a circular area centred over the emission peak and a radius of 0.7″. We obtained line fluxes of 973
± 89 mJy km s−1 and 929 ± 89 mJy km s−1 (for the 183 and 325 GHz lines, respectively). Since the 325 GHz line shows an absorption red-shifted component, we also computed the underlying flux
by considering the blue-shifted side only and multiplying it by a factor of 2. The resulting flux is 1,332 ± 89 mJy km s−1. The uncertainties on the line fluxes were computed by
bootstrapping over 100 circular apertures in emission-free regions of the map and do not account for absolute flux calibration uncertainties. The same operation was applied to the 321 GHz
line using a smaller 0.28″ radius extraction area. The resulting flux is 679 ± 135 mJy km s−1. The flux is much lower than the tentative detection by ref. 20 with the Submillimeter Array,
where, however, the line is shifted by 30 km s−1 from the systemic velocity, indicating that the proposed emission may be originating from a large-scale flow that we filter out in our
high-resolution data. For the 183 and 325 GHz lines, intensity-weighted velocity maps were generated using the bettermoments package44 after applying 4_σ_ and 3_σ_ clipping to individual
channels, respectively. The non-detection of the \({\mathrm{H}}_{2}^{18}{\mathrm{O}}\) 322 GHz line is shown in Extended Data Fig. 1. FITTING OF THE 183 GHZ LINE SPECTRUM Given the high SNR
of the 183 GHz line, we fitted its spectrum by analytically computing model spectra of a geometrically thin Keplerian disk, similarly to ref. 45. To do so, we assumed that the peak
brightness temperature of the line decreases with radius as a power law: $$T(R)={T}_{0}{\left(\frac{R}{10{{{\,\rm{au}}}}}\right)}^{-q}.$$ (1) For a given radius _R_ and azimuth _ϕ_, we
assumed that the line intensity follows a Gaussian distribution velocity: $$I(R,\phi ,v)=\frac{{B}_{\nu }(T\,)}{{d}^{2}}\exp \left(-\frac{\mu
{m}_{{{{\rm{H}}}}}{(v-{v}_{{{{\rm{K}}}},{{{\rm{proj}}}}})}^{2}}{2{k}_{{{{\rm{B}}}}}T}\right),$$ (2) where _B__ν_(_T_) is the Planck function at temperature _T_, _k_B is the Boltzmann
constant, _d_ is the distance of HL Tau (140 pc), _μ__m_H is the mass of the water molecule and the Keplerian velocity projected along the line of sight _v_K,proj can be written as follows:
$${v}_{{{{\rm{K}}}},{{{\rm{proj}}}}}={\left(\frac{G{M}_{\odot }}{R}\right)}^{1/2}\sin i\cos \phi ,$$ (3) where _i_ is the source inclination (46.7°) and _G_ is the gravitational constant. We
considered an optically thick limit when assuming a thermal broadening with a kinetic temperature equalling the brightness temperature. The flux density of the line can then be computed at
every velocity _v_ by integrating across the whole disk: $$F(v)=\cos i\int\nolimits_{0}^{2\uppi }\int\nolimits_{{R}_{{{{\rm{in}}}}}}^{{R}_{{{{\rm{out}}}}}}I(R,\phi
,v)R{\mathrm{d}}R{\mathrm{d}}\phi ,$$ (4) where \(\cos i\) accounts for the geometrical projection on the sky. We fixed _R_in to 0.1 au (but the model is not sensitive to this value for
reasonably small radii) and sampled the disk with 150 points in radius and 550 in azimuth. We then convolved the models with a Gaussian kernel with the same channel width as in the data and
sampled them at the same velocities. We kept three free parameters in the fitting procedure: _T_0, _q_ and _R_out. We fitted the spectrum shown in Fig. 2 with the emcee package using flat
priors on the three free parameters: [10,1500] K, [0,3], [2,200] au, respectively. We used 30 walkers, 1,000 steps of burn-in and 1,000 additional steps to sample the posterior distribution.
Extended Data Fig. 2 shows the best-fit model and 100 random draws extracted from the posterior distribution. While the fit does not manage to constrain the outer radius of the emission, we
obtain \({T}_{0}=28{7}_{-154}^{+180}\) and \(q=0.9{2}_{-0.47}^{+0.30}\). The fit highlights a negative brightness temperature gradient in the radial profile, as seen in the reconstructed
integrated intensity profile (Fig. 3) and as hinted by the rotational diagram shown in Fig. 4. PARAMETRIC FIT OF THE INTEGRATED INTENSITY PROFILE IN THE VISIBILITY PLANE In order to extract
the radial extent of the 183 GHz line, we performed a parametric fit of its integrated intensity radial profile in the visibility plane by exploiting the galario package. After averaging the
continuum-subtracted visibilities in the same spectral range used to compute the moment 0 map, we fitted the visibility data by Fourier transforming a projected integrated intensity profile
in the same _uv_ points sampled during the observations. We modelled the radial profile with a simple Gaussian prescription $$J(R)={J}_{0}\,\exp \left(-\frac{{R}^{2}}{2{\sigma
}_{{{{\rm{G}}}}}^{2}}\right),$$ (5) where we considered four free parameters: _J_0, _σ_G and the disk centre (ΔRA and ΔDec). We fixed the inclination and PA to those obtained from
high-resolution continuum imaging24. The fit was performed with the emcee package, where the _J_0 parameter was sampled in log space. We used the following flat priors on the parameters:
$$\begin{array}{l}{\log }_{10}({\,J}_{0}/{{{\rm{steradian}}}})\in [1,20],{\sigma }_{{{{\rm{G}}}}}\in {[0,1.5]}^{{\prime\prime} },\Delta {{{\rm{RA}}}}\in\\ {[-0.4,0.4]}^{{\prime\prime}
},\Delta {{{\rm{dec.}}}}\in {[-0.4,0.4]}^{{\prime\prime} }.\end{array}$$ The posterior distribution was sampled with 50 walkers and 1,000 steps, after 1,000 steps of burn-in. The MCMC
exploration of the posterior space converges well, as shown in Extended Data Fig. 3. ROTATIONAL DIAGRAM AND OPTICAL DEPTH CONSTRAINTS To compute the rotational diagram of the water molecule,
we use the same approach as in, for example, refs. 46,47. In the optically thin assumption, we can compute the column density _N_thin and the rotational temperature _T_rot by measuring the
integrated flux _S__ν_Δ_v_: $${N}_{{{{\rm{thin}}}}}=\frac{4\uppi }{{A}_{{{{\rm{ul}}}}}hc}\frac{{S}_{\nu }\Delta v}{\varOmega }\frac{Q({T}_{{{{\rm{rot}}}}})}{{g}_{{{{\rm{u}}}}}}\,\exp
\left(\frac{{E}_{{{{\rm{u}}}}}}{{T}_{{{{\rm{rot}}}}}}\right),$$ (6) where _Ω_ is the solid angle used for flux extraction (see previous section), _A_ul is the Einstein coefficient of the
considered transition, _h_ and _c_ are the Planck constant and the speed of light in vacuum, _Q_ is the partition function, _E_u is the upper state energy (in K) and _g_u is the upper state
degeneracy. Using the relation between _N_u,thin and _N_thin, the same equation can be written in logarithmic form48: $$\ln \frac{{N}_{{{{\rm{u}}}},{{{\rm{thin}}}}}}{{g}_{{{{\rm{u}}}}}}=\ln
{N}_{{{{\rm{thin}}}}}-\ln Q({T}_{{{{\rm{rot}}}}})-{E}_{{{{\rm{u}}}}}/{T}_{{{{\rm{rot}}}}}.$$ (7) We performed a linear regression using the emcee sampler49 in the \([\ln
({N}_{{{{\rm{u}}}},{{{\rm{thin}}}}}/{g}_{{{{\rm{u}}}}}),\,{E}_{{{{\rm{u}}}}}]\) space to extract _N_thin and _T_rot. We used the molecular coefficients reported in Table 3. In the fitter,
the partition function was determined with a cubic spline interpolation across the rotational temperatures listed in ref. 37. The same approach was used for the rotation diagram analysis
with six to eight transitions of o- and p-water in evolved stars50. In the MCMC sampling, we used 128 walkers and 2,000 steps (after 1,000 steps of burn-in). While Fig. 4 shows the result
and the marginalized posterior distributions of the fit of all three lines, Extended Data Fig. 4 portrays the individual fits on the two colder and warmer lines, respectively. To compute the
upper limit on the optical depth of the 325 GHz water line, we exploited the non-detection of the \({\mathrm{H}}_{2}^{18}{\mathrm{O}}\) line, which has almost identical molecular
coefficients. Assuming that the column density of the main isotopologue line (\({\tau }_{{{{{\rm{H}}}}}_{2}{{{\rm{O}}}}}\)) is equal to \(530\times {\tau
}_{{{{{\rm{H}}}}}_{2}^{18}{{{\rm{O}}}}}\) (ref. 40), we can write $$\frac{{({S}_{\nu }\Delta v)}_{{{{{\rm{H}}}}}_{2}{{{\rm{O}}}}}}{{({S}_{\nu }\Delta
v)}_{{{{{\rm{H}}}}}_{2}^{18}{{{\rm{O}}}}}}\approx \frac{1-{\rm{e}}^{-{\tau }_{{{{{\rm{H}}}}}_{2}{{{\rm{O}}}}}}}{1-{\rm{e}}^{-{\tau }_{{{{{\rm{H}}}}}_{2}{{{\rm{O}}}}}/530}}.$$ (8) Using the
3_σ_ upper limit on the \({\mathrm{H}}_{2}^{18}{\mathrm{O}}\) transition and the measured flux of the H2O line (after correcting for absorption, since the absorbing column of
\({\mathrm{H}}_{2}^{18}{\mathrm{O}}\) will have the same scaling factor of 530), a numerical solution of the equations leads to \({\tau }_{{{{{\rm{H}}}}}_{2}{{{\rm{O}}}}} < 14\), as
reported in the main text. DATA AVAILABILITY All the ALMA data are publicly available on the ALMA archive (https://almascience.nrao.edu/aq/), with program IDs 2017.1.01178.S and
2022.1.00905.S. CODE AVAILABILITY The Python packages used in the data analysis are all publicly available. The calibration and fitting scripts can be obtained from S.F. upon reasonable
request. CHANGE HISTORY * _ 13 SEPTEMBER 2024 A Correction to this paper has been published: https://doi.org/10.1038/s41550-024-02383-9 _ REFERENCES * Kreidberg, L. et al. A precise water
abundance measurement for the hot Jupiter WASP-43b. _Astrophys. J. Lett._ 793, L27 (2014). Article ADS MATH Google Scholar * Madhusudhan, N. Exoplanetary atmospheres: key insights,
challenges, and prospects. _Annu. Rev. Astron. Astrophys._ 57, 617–663 (2019). Article ADS MATH Google Scholar * Rustamkulov, Z. et al. Early release science of the exoplanet WASP-39b
with JWST NIRSpec PRISM. _Nature_ 614, 659–663 (2023). Article ADS Google Scholar * van Dishoeck, E. F., Bergin, E. A., Lis, D. C. & Lunine, J. I. in _Protostars and Planets VI_ (eds
Beuther, H. et al.) 835–858 (Univ. Arizona Press, 2014). * Drażkowska, J. et al. in _Protostars and Planets VII_ (eds Inutsuka, S. et al.) 717–758 (Univ. Arizona Press, 2023). * Cuzzi, J. N.
& Zahnle, K. J. Material enhancement in protoplanetary nebulae by particle drift through evaporation fronts. _Astrophys. J._ 614, 490–496 (2004). Article ADS Google Scholar *
Schoonenberg, D. & Ormel, C. W. Planetesimal formation near the snowline: in or out? _Astron. Astrophys._ 602, A21 (2017). Article ADS Google Scholar * Drażkowska, J. & Alibert,
Y. Planetesimal formation starts at the snow line. _Astron. Astrophys._ 608, A92 (2017). Article ADS MATH Google Scholar * Öberg, K. I., Murray-Clay, R. & Bergin, E. A. The effects
of snowlines on C/O in planetary atmospheres. _Astrophys. J._ 743, L16 (2011). Article ADS MATH Google Scholar * Eistrup, C., Walsh, C. & van Dishoeck, E. F. Setting the volatile
composition of (exo)planet-building material. Does chemical evolution in disk midplanes matter? _Astron. Astrophys._ 595, A83 (2016). Article MATH Google Scholar * Öberg, K. I., Facchini,
S. & Anderson, D. E. Protoplanetary disk chemistry. _Annu. Rev. Astron. Astrophys._ 61, 287–328 (2023). Article ADS Google Scholar * Hogerheijde, M. R. et al. Detection of the water
reservoir in a forming planetary system. _Science_ 334, 338 (2011). Article ADS MATH Google Scholar * van Dishoeck, E. F. et al. Water in star-forming regions: physics and chemistry from
clouds to disks as probed by Herschel spectroscopy. _Astron. Astrophys._ 648, A24 (2021). Article MATH Google Scholar * Pontoppidan, K. M., Salyk, C., Blake, G. A. & Käufl, H. U.
Spectrally resolved pure rotational lines of water in protoplanetary disks. _Astrophys. J. Lett._ 722, L173–L177 (2010). Article ADS Google Scholar * Grant, S. L. et al. MINDS. The
detection of 13CO2 with JWST-MIRI indicates abundant CO2 in a protoplanetary disk. _Astrophys. J. Lett._ 947, L6 (2023). Article ADS MATH Google Scholar * Kóspál, Á. et al. JWST/MIRI
spectroscopy of the disk of the young eruptive star EX Lup in quiescence. _Astrophys. J. Lett._ 945, L7 (2023). Article ADS MATH Google Scholar * Banzatti, A. et al. JWST reveals excess
cool water near the snow line in compact disks, consistent with pebble drift. _Astrophys. J. Lett._ 957, L22 (2023). Article ADS MATH Google Scholar * Salyk, C. et al. Detection of water
vapor in the terrestrial planet forming region of a transition disk. _Astrophys. J. Lett._ 810, L24 (2015). Article ADS MATH Google Scholar * Tobin, J. J. et al. Deuterium-enriched
water ties planet-forming disks to comets and protostars. _Nature_ 615, 227–230 (2023). Article ADS MATH Google Scholar * Kristensen, L. E., Brown, J. M., Wilner, D. & Salyk, C.
Velocity-resolved hot water emission detected toward HL Tau with the Submillimeter Array. _Astrophys. J. Lett._ 822, L20 (2016). Article ADS Google Scholar * Carr, J. S., Najita, J. R.
& Salyk, C. Measuring the water snow line in a protoplanetary disk. _Res. Notes AAS_ 2, 169 (2018). Article ADS Google Scholar * Bosman, A. D. & Bergin, E. A. Reimagining the
water snowline. _Astrophys. J. Lett._ 918, L10 (2021). Article ADS MATH Google Scholar * Notsu, S. et al. Dust continuum emission and the upper limit fluxes of submillimeter water lines
of the protoplanetary disk around HD 163296 observed by ALMA. _Astrophys. J._ 875, 96 (2019). Article ADS Google Scholar * ALMA Partnership. et al. The 2014 ALMA long baseline campaign:
first results from high angular resolution observations toward the HL Tau region. _Astrophys. J. Lett._ 808, L3 (2015). Article ADS MATH Google Scholar * Yen, H.-W. et al. HL Tau disk in
HCO+ (3-2) and (1-0) with ALMA: gas density, temperature, gap, and one-arm spiral. _Astrophys. J._ 880, 69 (2019). Article ADS MATH Google Scholar * Riviere-Marichalar, P. et al.
Detection of warm water vapour in Taurus protoplanetary discs by Herschel. _Astron. Astrophys._ 538, L3 (2012). Article ADS MATH Google Scholar * Salyk, C. et al. A high-resolution
mid-infrared survey of water emission from protoplanetary disks. _Astrophys. J._ 874, 24 (2019). Article ADS Google Scholar * Belitsky, V. et al. ALMA band 5 receiver cartridge. Design,
performance, and commissioning. _Astron. Astrophys._ 611, A98 (2018). Article MATH Google Scholar * Notsu, S. et al. Candidate water vapor lines to locate the H2O snowline through
high-dispersion spectroscopic observations. II. The case of a Herbig Ae star. _Astrophys. J._ 836, 118 (2017). Article ADS MATH Google Scholar * Notsu, S. et al. Candidate water vapor
lines to locate the H2O snowline through high-dispersion spectroscopic observations. III. Submillimeter H216O and H218O lines. _Astrophys. J._ 855, 62 (2018). Article ADS Google Scholar *
CASA Team. et al. CASA, the Common Astronomy Software Applications for radio astronomy. _Publ. Astron. Soc. Pac._ 134, 114501 (2022). Article ADS MATH Google Scholar * Garufi, A. et al.
ALMA chemical survey of disk-outflow sources in Taurus (ALMA-DOT). V. Sample, overview, and demography of disk molecular emission. _Astron. Astrophys._ 645, A145 (2021). Article MATH
Google Scholar * Garufi, A. et al. ALMA chemical survey of disk-outflow sources in Taurus (ALMA-DOT). VI. Accretion shocks in the disk of DG Tau and HL Tau. _Astron. Astrophys._ 658, A104
(2022). Article MATH Google Scholar * Tazzari, M., Beaujean, F. & Testi, L. GALARIO: a GPU accelerated library for analysing radio interferometer observations. _Mon. Not. R. Astron.
Soc._ 476, 4527–4542 (2018). Article ADS MATH Google Scholar * Teague, R. GoFish: fishing for line observations in protoplanetary disks. _J. Open Source Soft._ 4, 1632 (2019). Article
ADS MATH Google Scholar * Carrasco-González, C. et al. The radial distribution of dust particles in the HL Tau disk from ALMA and VLA observations. _Astrophys. J._ 883, 71 (2019). Article
ADS MATH Google Scholar * Polyansky, O. L. et al. ExoMol molecular line lists XXX: a complete high-accuracy line list for water. _Mon. Not. R. Astron. Soc._ 480, 2597–2608 (2018).
Article ADS MATH Google Scholar * Bethell, T. & Bergin, E. Formation and survival of water vapor in the terrestrial planet-forming region. _Science_ 326, 1675 (2009). Article ADS
MATH Google Scholar * Baulch, D. L. _Evaluated Kinetic Data for High Temperature Reactions_ (CRC Press, 1972). * McKeegan, K. D. et al. The oxygen isotopic composition of the sun inferred
from captured solar wind. _Science_ 332, 1528 (2011). Article ADS MATH Google Scholar * Schroeder I, I. R. H. G. et al. 16O/18O ratio in water in the coma of comet
67P/Churyumov-Gerasimenko measured with the Rosetta/ROSINA double-focusing mass spectrometer. _Astron. Astrophys._ 630, A29 (2019). Article Google Scholar * Weaver, E., Isella, A. &
Boehler, Y. Empirical temperature measurement in protoplanetary disks. _Astrophys. J._ 853, 113 (2018). Article ADS MATH Google Scholar * Andrews, S. M. et al. The Disk Substructures at
High Angular Resolution Project (DSHARP). I. Motivation, sample, calibration, and overview. _Astrophys. J._ 869, L41 (2018). Article ADS MATH Google Scholar * Teague, R. &
Foreman-Mackey, D. A robust method to measure centroids of spectral lines. _Res. Notes AAS_ 2, 173 (2018). Article ADS MATH Google Scholar * Zagaria, F. et al. Testing protoplanetary
disc evolution with CO fluxes. A proof of concept in Lupus and Upper Sco. _Astron. Astrophys._ 672, L15 (2023). Article ADS MATH Google Scholar * Loomis, R. A. et al. The distribution
and excitation of CH3CN in a solar nebula analog. _Astrophys. J._ 859, 131 (2018). Article ADS MATH Google Scholar * Facchini, S. et al. The chemical inventory of the planet-hosting disk
PDS 70. _Astron. J._ 162, 99 (2021). Article ADS MATH Google Scholar * Goldsmith, P. F. & Langer, W. D. Population diagram analysis of molecular line emission. _Astrophys. J._ 517,
209–225 (1999). Article ADS MATH Google Scholar * Foreman-Mackey, D., Hogg, D. W., Lang, D. & Goodman, J. emcee: the MCMC hammer. _Publ. Astron. Soc. Pac._ 125, 306 (2013). Article
ADS MATH Google Scholar * Baudry, A. et al. ATOMIUM: probing the inner wind of evolved O-rich stars with new, highly excited H2O and OH lines. _Astron. Astrophys._ 674, A125 (2023).
Article MATH Google Scholar * Pickett, H. M. et al. Submillimeter, millimeter and microwave spectral line catalog. _J. Quant. Spectrosc. Radiat. Transf._ 60, 883–890 (1998). Article ADS
MATH Google Scholar * Barber, R. J., Tennyson, J., Harris, G. J. & Tolchenov, R. N. A high-accuracy computed water line list. _Mon. Not. R. Astron. Soc._ 368, 1087–1094 (2006).
Article ADS MATH Google Scholar Download references ACKNOWLEDGEMENTS This paper makes use of the following ALMA data: ADS/JAO.ALMA#2017.1.01178.S, ADS/JAO.ALMA#2022.1.00905.S. ALMA is a
partnership of the European Southern Observatory (representing its member states), the National Science Foundation (USA) and the National Institutes of Natural Sciences (Japan), together
with the National Research Council (Canada), the Ministry of Science and Technology and Academia Sinica Institute of Astronomy and Astrophysics (Taiwan), and the Korea Astronomy and Space
Science Institute (Republic of Korea), in cooperation with the Republic of Chile. The Joint ALMA Observatory is operated by the European Southern Observatory, Associated Universities
Inc./National Radio Astronomy Observatory and the National Astronomical Observatory of Japan. S.F. is funded by the European Union (European Research Council (ERC), UNVEIL, 101076613). Views
and opinions expressed, however, are those of the author(s) only and do not necessarily reflect those of the European Union or the ERC. Neither the European Union nor the granting authority
can be held responsible for them. S.F. acknowledges financial contribution from PRIN-MUR POPS 2022YP5ACE. L.T. acknowledges funding from Progetti Premiali 2012 iALMA (CUP C52I13000140001),
Deutsche Forschungs-gemeinschaft (German Research Foundation) ref no. 325594231 FOR 2634/1 TE 1024/1-1, European Union’s Horizon 2020 research and innovation programme under the Marie
Sklodowska-Curie grant no. 823823 (DUSTBUSTERS) and the ERC via the ERC Synergy Grant ECOGAL (grant no. 855130). M.V.D. acknowledges support from Wallonie–Bruxelles International (Belgium)
through its grant ‘Stage en Organisation Internationale’ and the French-speaking Community of Belgium through its FRIA grant. AUTHOR INFORMATION AUTHORS AND AFFILIATIONS * Dipartimento di
Fisica, Università degli Studi di Milano, Milano, Italy Stefano Facchini * Dipartimento di Fisica e Astronomia ‘Augusto Righi’, Università di Bologna, Bologna, Italy Leonardo Testi *
European Southern Observatory, Garching bei München, Germany Elizabeth Humphreys * Joint ALMA Observatory, Santiago, Chile Elizabeth Humphreys * European Southern Observatory (ESO) Vitacura,
Santiago, Chile Elizabeth Humphreys * Space sciences, Technologies & Astrophysics Research (STAR) Institute, University of Liège, Liège, Belgium Mathieu Vander Donckt * Department of
Physics and Astronomy, Rice University, Houston, TX, USA Andrea Isella & Ramon Wrzosek * Laboratoire d’Astrophysique de Bordeaux, Univ. de Bordeaux, CNRS, Pessac, France Alain Baudry *
National Astronomical Research Institute of Thailand, Chiangmai, Thailand Malcom D. Gray * Jodrell Bank Centre for Astrophysics, University of Manchester, Manchester, UK Anita M. S. Richards
* Department of Space, Earth and Environment, Chalmers University of Technology, Göteborg, Sweden Wouter Vlemmings Authors * Stefano Facchini View author publications You can also search
for this author inPubMed Google Scholar * Leonardo Testi View author publications You can also search for this author inPubMed Google Scholar * Elizabeth Humphreys View author publications
You can also search for this author inPubMed Google Scholar * Mathieu Vander Donckt View author publications You can also search for this author inPubMed Google Scholar * Andrea Isella View
author publications You can also search for this author inPubMed Google Scholar * Ramon Wrzosek View author publications You can also search for this author inPubMed Google Scholar * Alain
Baudry View author publications You can also search for this author inPubMed Google Scholar * Malcom D. Gray View author publications You can also search for this author inPubMed Google
Scholar * Anita M. S. Richards View author publications You can also search for this author inPubMed Google Scholar * Wouter Vlemmings View author publications You can also search for this
author inPubMed Google Scholar CONTRIBUTIONS S.F. and E.H. led the ALMA observing proposals. S.F. calibrated the data and performed the data analysis. S.F. and L.T. wrote the manuscript. All
co-authors provided input on the manuscript. CORRESPONDING AUTHOR Correspondence to Stefano Facchini. ETHICS DECLARATIONS COMPETING INTERESTS The authors declare no competing interests.
PEER REVIEW PEER REVIEW INFORMATION _Nature Astronomy_ thanks Shota Notsu and the other, anonymous, reviewer(s) for their contribution to the peer review of this work. ADDITIONAL INFORMATION
PUBLISHER’S NOTE Springer Nature remains neutral with regard to jurisdictional claims in published maps and institutional affiliations. EXTENDED DATA EXTENDED DATA FIG. 1 NON-DETECTION OF
THE 322 GHZ \({\MATHRM{H}}_{2}^{18}{\MATHRM{O}}\) LINE. Spectrum of the 322 GHz \({\mathrm{H}}_{2}^{18}{\mathrm{O}}\) line, extracted over a circle with radius of 0. 7_″_ centered on the
continuum peak, as for Fig. 2. Two spectra are shown, from channel maps with two different channel widths. The grey dashed line indicates the systemic velocity of 7.1 km s−1 32,33. In the
top left 2_σ_ scale bars are reported for reference. EXTENDED DATA FIG. 2 CORNER PLOT OF THE RADIAL EXTENT OF THE 183 GHZ LINE. Marginalized posterior distribution of the galario fit of the
visibility points of the integrated intensity of the 183 GHz line (see Fig. 3). The dashed lines indicate the 16th, 50th and 84th percentiles of the marginalized posterior distributions.
EXTENDED DATA FIG. 3 FIT OF THE 183 GHZ LINE SPECTRUM. Left: spectrum of the 183 GHz H2O line, as in Fig. 2. The uncertainty associated to each data point is shown in the left part of the
spectrum as an errorbar. A random sampling of 100 profiles from the posterior distribution of the MCMC fit is shown, with the dark red line indicating the bestfit model. Right: marginalized
posterior distribution of the fitted parameters, where no constraint can be retrieved on _R_out from this analysis. EXTENDED DATA FIG. 4 ROTATIONAL DIAGRAMS OF LINE PAIRS. Rotational
diagrams and marginalized posterior distribution of the MCMC exploration for individual fits on the two lowest and two highest energy lines, respectively. The green dashed line in the left
panels shows the best fit. The black dashed lines in the corner plots indicate the 16th, 50th and 84th percentiles of the marginalized posterior distributions. RIGHTS AND PERMISSIONS OPEN
ACCESS This article is licensed under a Creative Commons Attribution 4.0 International License, which permits use, sharing, adaptation, distribution and reproduction in any medium or format,
as long as you give appropriate credit to the original author(s) and the source, provide a link to the Creative Commons licence, and indicate if changes were made. The images or other third
party material in this article are included in the article’s Creative Commons licence, unless indicated otherwise in a credit line to the material. If material is not included in the
article’s Creative Commons licence and your intended use is not permitted by statutory regulation or exceeds the permitted use, you will need to obtain permission directly from the copyright
holder. To view a copy of this licence, visit http://creativecommons.org/licenses/by/4.0/. Reprints and permissions ABOUT THIS ARTICLE CITE THIS ARTICLE Facchini, S., Testi, L., Humphreys,
E. _et al._ Resolved ALMA observations of water in the inner astronomical units of the HL Tau disk. _Nat Astron_ 8, 587–595 (2024). https://doi.org/10.1038/s41550-024-02207-w Download
citation * Received: 24 August 2023 * Accepted: 18 January 2024 * Published: 29 February 2024 * Issue Date: May 2024 * DOI: https://doi.org/10.1038/s41550-024-02207-w SHARE THIS ARTICLE
Anyone you share the following link with will be able to read this content: Get shareable link Sorry, a shareable link is not currently available for this article. Copy to clipboard Provided
by the Springer Nature SharedIt content-sharing initiative
Trending News
Drivers urged to pay car tax ahead of major ved changes next monthThe standard rate will increase by £10 for most cars which were first registered on or after April 1, 2017. For cars reg...
Let us now praise independent publishers | thearticleA few days ago, Pushkin Press was awarded the 2022 British Book Award for Independent Publisher of the Year. It was enti...
Page Not Found很抱歉,你所访问的页面已不存在了。 如有疑问,请电邮[email protected] 你仍然可选择浏览首页或以下栏目内容 : 新闻 生活 娱乐 财经 体育 视频 播客 新报业媒体有限公司版权所有(公司登记号:202120748H)...
Spatio-temporal changes in the causal interactions among sustainable development goals in chinaABSTRACT Extensive efforts have been dedicated to deciphering the interactions associated with Sustainable Development G...
Children's hospice launches trailblazing transition support role | nursing timesA charity that provides hospice care to seriously ill children in the North West of England is blazing a trail in the se...
Latests News
Resolved alma observations of water in the inner astronomical units of the hl tau diskABSTRACT The water molecule is a key ingredient in the formation of planetary systems, with the water snowline being a f...
The political aims of ‘xi jinping thought’The Diplomat author Mercy Kuo regularly engages subject-matter experts, policy practitioners, and strategic thinkers acr...
In memoriam—norton herbert neff, ph. D. (1935–2022)With sorrow, we announce that Norton Herbert Neff, ACNP Fellow Emeritus, died on September 5th, 2022, at the age of 87. ...
777 charlie trailer: rakshit shetty starrer promises a heartfelt, feel-good filmDhanush, on Monday, unveiled the trailer for _777 Charlie_. He tweeted, “Happy to release the trailer of #777Charlie. Al...
Dc republicans once again refuse to rein in spending - fitsnewsAt this point, it is hardly newsworthy to report that Republicans (a.k.a. the other party of big government in Washingto...