Urbanization and agricultural intensification destabilize animal communities differently than diversity loss
Urbanization and agricultural intensification destabilize animal communities differently than diversity loss"
- Select a language for the TTS:
- UK English Female
- UK English Male
- US English Female
- US English Male
- Australian Female
- Australian Male
- Language selected: (auto detect) - EN
Play all audios:
ABSTRACT Despite growing concern over consequences of global changes, we still know little about potential interactive effects of anthropogenic perturbations and diversity loss on the
stability of local communities, especially for taxa other than plants. Here we analyse the relationships among landscape composition, biodiversity and community stability looking at time
series of three types of communities, i.e., bats, birds and butterflies, monitored over the years by citizen science programs in France. We show that urban and intensive agricultural
landscapes as well as diversity loss destabilize these communities but in different ways: while diversity loss translates into greater population synchrony, urban and intensive agricultural
landscapes mainly decrease mean population stability. In addition to highlight the stabilizing effects of diversity on ecologically important but overlooked taxa, our results further reveal
new pathways linking anthropogenic activities to diversity and stability. SIMILAR CONTENT BEING VIEWED BY OTHERS ANTHROPOGENIC CLIMATE AND LAND-USE CHANGE DRIVE SHORT- AND LONG-TERM
BIODIVERSITY SHIFTS ACROSS TAXA Article Open access 12 February 2024 CONSISTENT STABILIZING EFFECTS OF PLANT DIVERSITY ACROSS SPATIAL SCALES AND CLIMATIC GRADIENTS Article 19 September 2022
SPECIES TURNOVER DOES NOT RESCUE BIODIVERSITY IN FRAGMENTED LANDSCAPES Article 12 March 2025 INTRODUCTION Temporal stability, that is to say the level of variation through time, of biomass
or abundance can vary greatly across local communities, and the causes of such variations remain poorly understood1. The stability of plant and animal community abundances is important for
the maintenance of ecosystem processes and services over time, as these communities are involved in key functions such as primary and secondary productions, pollination, and pest control2.
In the past decades, research on the stability of community properties and ecosystem processes has mainly focused on consequences of ongoing biodiversity loss, often on plant communities2,3,
revealing a negative effect of diversity loss on the temporal stability of communities4,5,6. This destabilizing effect of diversity loss appears mainly related to lower asynchrony among
population dynamics in species poor communities5,6. Recently, a few studies brought to light the importance of other major anthropogenic changes, such as nutrient eutrophication and climate
warming, on plant community stability and associated primary production7,8,9,10. While some of these studies highlight that anthropogenic changes affect ecosystem stability mainly via
changes in biodiversity7,11, other studies suggest independent effects of diversity and environmental changes on stability12. Resolving this discrepancy is key to our understanding of the
mechanisms by which global changes affect the stability of ecosystem functions and services13, and therefore to our ability to mitigate adverse effects. Furthermore, to our knowledge
existing studies mainly focused on plant communities, resulting in a knowledge gap regarding animal communities. At a global scale, the conversion and degradation of habitats related to
human activities are recognized as major drivers of local diversity loss, urban and intensive agricultural land-use being most detrimental14. Despite the paramount importance of habitat
degradation on biodiversity, only a few recent studies have investigated the consequences of land-use intensity on the temporal stability of population abundances or community total
abundances15,16, i.e., the total number of individuals present in a community, across all species of this community. To investigate the mechanisms by which diversity loss and habitat
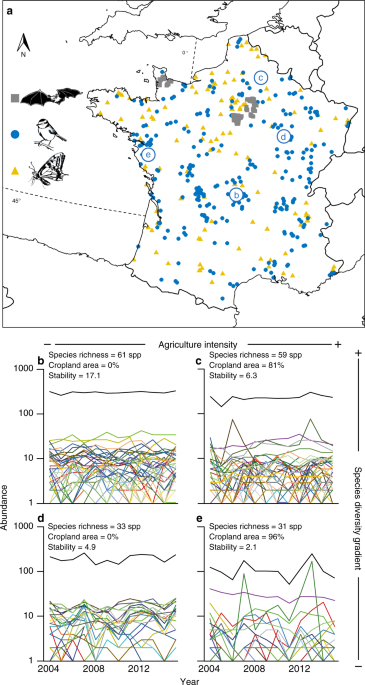
degradation affect community stability, we analyze the inter-annual abundance fluctuations of 152 bat, 269 bird and 130 butterfly communities across France, monitored following standardized
protocols over six, 17 and 11 years, respectively (Fig. 1, Supplementary Table 1, see “Methods”). The three taxonomic groups are not monitored on the same sites as data comes from three
independent citizen science programs (see “Methods”). While bats and insectivorous birds are recognized as important for pest control17,18, butterflies contribute to pollination19, and
frugivorous birds are essential for plant dispersal18. As such, understanding what determine the stability of these communities might be relevant to understand the stability of the functions
and services they provide. We analyze the landscape surrounding each sampling site looking at its composition, heterogeneity, and the level of agricultural inputs used (see “Methods”).
Using a principal component analysis on these data, we distinguish two independent habitat degradation gradients (Fig. 2). First an urban gradient opposing sites surrounded by urban and
sealed soil areas to sites surrounded by semi-natural and agricultural landscape. Second, an agricultural intensity gradient, opposing sites within landscapes dominated by cropland areas
with high agricultural inputs to sites surrounded by heterogenous landscape including higher proportion of woodland areas and seminatural open areas. For each sites, we compute local Shannon
index as species diversity and mean pairwise distance (MPD) as phylogenetic diversity (Supplementary Table 2, see “Methods”), as there is still debate on which aspect of diversity better
relates to community stability20,21. Because species in natural communities are not evenly abundant and then do not have the same contribution to the community stability, we weight the two
diversity measures by species relative abundance. We then partition community stability, measured as the inverse of the coefficient of variation of community abundance across time, into a
population asynchrony and a weighted mean population stability component22 (Supplementary Table 2, see “Methods”). Those complementary components of community stability have different
implications. Lower population stability increases species extinction risks23, while lower population asynchrony reduces the insurance effect of diversity on the provision of ecosystem
functions and services24. These two components of community stability involve partly different mechanisms. Population asynchrony strongly relates to the diversity of species responses to
environmental variations25 but also to species interactions such as competition26. Population stability is known to depend on environment variability27 and on interactions among species such
as competition or predation28,29. While both components appear to be key to the stability of experimental plant communities4,5, their relative contributions to variations in stability of
natural communities experiencing various perturbation regimes is poorly known. We use structural equation modeling (SEM) to quantify how both components of community stability are affected
by local diversity and landscape composition, as well as to disentangle the direct and indirect (i.e., mediated by diversity changes) effects of landscape composition on community stability
(see Methods). Our analysis reveals that habitat degradation and diversity loss destabilize ecological communities but in different ways: while diversity loss destabilizes communities by
increasing population synchrony, the destabilizing effect of urban and intensive agricultural landscapes mainly comes from a decrease in population stability. RESULTS AND DISCUSSION
DIVERSITY LOSS AND HABITAT DEGRADATION EFFECTS ON STABILITY Our results show that communities with low diversity or located in anthropogenic landscapes exhibit lower temporal stability than
more diverse communities or communities surrounded by more semi-natural and heterogeneous landscapes (Fig. 3), with overall effects of similar magnitude between the effects of diversity and
landscape composition (Table 1). DIVERSITY LOSS EFFECTS THROUGH POPULATION ASYNCHRONY The SEM suggests that the loss of both species diversity and phylogenetic diversity destabilize bat,
bird, and butterfly communities, and that this is mainly channeled by a decrease in population asynchrony (Table 1, Fig. 4, Supplementary Figs. 1–3). This extends classical results found for
experimental plant communities4,5 to animal taxa with very different natural history and thereby suggests that the positive biodiversity-stability relationship found for primary production
applies to other functions and services provided by animal communities. Our results also bring new support to the phylogenetic insurance hypothesis20, with a positive effect of phylogenetic
diversity on population asynchrony found for bat and butterfly communities. This suggests that for these taxa, related species tend to share the traits involved in their response to
environmental variations and perturbations30, and that we can use phylogeny as a proxy to assess the dynamical response of their populations to such environmental variations and
perturbations. DIVERSITY LOSS EFFECTS THROUGH POPULATION STABILITY The effects of species diversity and phylogenetic diversity on the weighted mean population stability are weaker and more
contrasted among the three taxa (Table 1, Fig. 4, Supplementary Figs. 1–3), reflecting previous theoretical and experimental findings on plants and plankton, which predict varying
diversity–population stability relationships depending on the community context considered28,29. LANDSCAPE COMPOSITION EFFECTS THROUGH POPULATION STABILITY Our results further highlight that
two major drivers of habitat degradation, urbanization and agricultural intensification, decrease community stability mainly via a decrease in the weighted mean population stability, this
for all three taxa (Table 1, Fig. 4, Supplementary Figs. 1–3). The mechanisms linking intensive agricultural landscapes and/or urban areas to lower weighted mean population stability may be
related to the diversity and availability of resources for species16,31. Overall, degraded habitats with less diverse and abundant resources, such as food supply, nesting, or breeding site
and hunting territory, are likely to result in smaller populations which, according to Taylor’s law32, might decrease their stability. Such a link between abundance and stability is
supported for bats and butterflies as their mean population abundances decline faster than their variances in degraded habitats (Supplementary Fig. 4, Supplementary Fig. 5), resulting the
observed declines in weighted mean population stability (Fig. 4). For birds, however, the destabilizing effect of agriculture is not related to decreased mean population abundances, but to
an increase in the temporal variance of populations in areas with intensive agricultural land-use (Supplementary Fig. 4). Such an effect suggests another potential mechanism where intensive
agricultural lands tend to increase the variability of available resources, such as crop pests, and/or tend to have more frequent and/or stronger pulse perturbations, such as pesticide
application. Our results also suggest differences among taxa in their susceptibilities to different types of habitat degradation. While butterfly community stability is mainly impacted by
urban areas, bird and bat communities are mostly destabilized in intensive agricultural landscapes (Fig. 3a, b, Table 1). This is coherent with previous studies on butterflies33 and
birds34,35, but could also stem from different levels of habitat degradation as butterfly communities were sampled in more urbanized areas than were bird and bat communities (Fig. 2). DIRECT
AND INDIRECT LANDSCAPE EFFECTS ON COMMUNITY STABILITY Although habitat degradation directly affects the diversity of all three taxa, the effects of habitat degradation on community
stability via population stability are 6.7, 2.2, and 20 times stronger than those mediated via its effects on both species diversity and phylogenetic diversity for bats, birds and
butterflies, respectively (Table 1, Fig. 4, Supplementary Figs. 1–3). These results contrast with previous findings on plants, butterflies, and birds indicating that anthropogenic
perturbations effects on community stability were mainly channeled by direct changes in diversity5 or population asynchrony15. Those contrasted findings across studies may stem from the fact
that habitat degradation affects the diversity of bat, bird, and butterfly communities in slightly more complex and contrasted ways than it affects their stability. Landscapes dominated by
intensive agriculture or urban areas decrease the species diversity of bird community, consistently with previous findings34. While landscapes dominated by urban area sharply decrease
butterfly species diversity as already found36, they increase the species diversity of bat communities and the phylogenetic diversity of bird and butterfly communities. Such positive effects
have already been shown for moderate levels of urbanization, where urban exploiters and exotic species can mix with urbanophobe species37,38. Such results also echo previous findings
highlighting complex patterns of species diversity variations along urban or agricultural intensity gradients associated with non-random changes in community composition37,39. LIMITS AND
CONCLUSION Here, we measured community stability at a relatively short-time scale (up to 6, 17, and 11 years for, respectively bat, bird, and butterfly communities), reflecting the time
scale used in most studies on the relationship between diversity and community stability6. However, population and community temporal variability are known to increase with the considered
time scale40,41,42 and as such, our estimates of temporal variability might underestimate the full variability of the studied communities. While this should not affect the effects of
landscape composition we found, and indeed our results are robust when compared with analyses on two subsets of our datasets with different time series durations (see “Methods” and
Supplementary Figs. 7–9), longer time series would be required to estimate the full variability of the studied communities. Another limitation of our study is that we assessed habitat
degradation at the landscape scale and did not account for local conditions, such as management practices, that could also affect community variability. For example, butterfly data were
collected in private gardens with different management strategies that are known to affect the attractiveness for butterflies43. Accounting for such management practices as well as other
local scale characteristics such as habitat heterogeneity that is also known to affect population stability16 would improve our understanding of the determinant of community stability. In
summary, our results extend to various animal communities the classical diversity–stability relationship found for plants5,6 and further uncover a population-level destabilizing effect of
habitat degradation. Moreover, by increasing the risks of extinction through the destabilization of populations, habitat degradation may also enhance the negative effect of diversity loss on
community stability. Besides advancing our understanding of the stability of animal communities and thereby the functions and services they deliver, our findings are also relevant for
biodiversity conservation and management as they identify different pathways affecting community stability on which conservation policies might act. Finally, by providing numerous long-term
time series of local communities under real perturbation regimes, citizen science monitoring-programs emerge as a major tool to further our understanding of the dynamical consequences of
current global change. METHODS COMMUNITY DYNAMICS DATASETS Yearly butterfly, bird, and bat abundance data were obtained across France from nationwide citizen science monitoring schemes, part
of the Vigie Nature program [http://vigienature.mnhn.fr/]. The monitoring sites are different among taxa as they depend on the residency of the volunteers and monitoring protocol used (see
below). For bat communities, we used data from the French bat-monitoring program [http://www.vigienature.fr/fr/chauves-souris], a citizen-science program running since 200644. Briefly,
volunteers record bat activity using ultrasound recorder while driving at a constant low-speed (25 ± 5 km/h) along 30 km circuits. These circuits were chosen to be close to the volunteer
residency, with low-traffic roads for security and representative of the different land-cover types in the area. These circuits are divided into ten 2-km transects where bats are recorded,
separated by 1-km road portions where recording is not carried out. Surveys start 30 min after sunset and last approximately 1.5 h. Weather conditions have to be suitable for the survey to
be carried out: no rain, wind speed below 7 m/s, temperature above 12 °C. Bat activity is recorded through echolocation calls with ultrasound detectors connected to a digital recorder.
Volunteers were trained to classify echolocation calls to the most accurate taxonomic level using Syrinx 2.645. Data validation was done by program coordinators at the Muséum national
d’Histoire naturelle for recordings with uncertain identification. Following previous works (e.g.,46), the abundance of each bat species in a 2-km road transect was defined as the number of
bat pass per species (a bat pass corresponds to a trigger of the bat detector in time expansion). We used data from transects surveyed between June 15th and July 31st (seasonal bat activity
peak) from four to 6 years between 2006 and 2012. This represented a total of 152 local bat communities, where a total of 7 species were recorded (Supplementary Table 1). For bird
communities, we used data from the French Breeding Bird Survey [http://www.vigie-plume.fr/]47, a monitoring program relying on keen birdwatchers to count birds annually in a given plot.
Plots are squares of 2 × 2 km2 randomly selected by the national coordinator, within which the surveyor places 10 points separated by at least 300 m, in order to cover all the habitats
present in the plot. Each plot is surveyed twice a year, the first session (to record nonmigrant birds and short distance migrants) between April 1st and May 8th, the second (to record
trans-saharian migrants) between May 9th and June 30th, with at least 4 weeks between both sessions. Surveying dates must be the same (±5 days) every year, and counting takes place in the
morning, starting 30 min after sunrise, with points always visited in the same order. At each point, the volunteer spends 5 min recording all birds seen or heard. Following previous work
(e.g.)47, yearly species abundance at a site was calculated as the sum of the maximum number of individuals detected per point over the two sessions. For this study, plots surveyed at least
eight years between 2001 and 2017 were selected, representing 269 local bird communities and 75 common species for which the amount of data available allows an accurate estimation of
population dynamic (Supplementary Table 1). For butterflies, we used data from the French garden butterfly observatory [http://www.vigienature.fr/fr/operation-papillons]48. Participants
identify and count Lepidoptera in their own garden, from a closed list of 28 common species or species groups (27 butterflies and one common diurnal moth, _Macroglossum stellatarum_). Since
some of the taxa targeted by this scheme group several look-alike species (species groups), we only kept the 13 butterflies and 1 moth identified at species level for our analyses
(Supplementary Table 1). The temporal variability of the butterfly community restricted to these 14 species reflects that of the community including the abundance of the species groups
(Supplementary Fig. 6). For each species, abundances are recorded monthly, as the maximum number of butterflies seen simultaneously during the month. Counting takes place from March to
October, but for this study, gardens that had been monitored in July at least seven years between 2007 and 2018 were selected, except for the year 2014 because of a crash of the database
server, representing 130 local butterfly communities. Our data selection presented and analyzed in the main text totalized 551 sites (Dataset 1), with variations in the number of years
across sites and taxa. This leads to 65, 7, and 80 sites with time series of, respectively 4–6 years for bats; 3, 14, 37, 32, 29, 33, 49, 30, 30, and 12 sites with time series of,
respectively, 8–17 years for birds; and 34, 12, 10, 17, and 57 sites with time series of, respectively, 7–11 years for butterflies. To test the robustness of our results to the presence of
gaps in the time series, we also ran our analyses on two subsets of the dataset that included only time series of the same duration and with no missing year. The first subset was restricted
to the longest fully overlapping observation period with no gap common to all sites, leading to times series of 4, 8, and 7 years for bats, butterflies and birds, respectively (Dataset 2).
The second one was restricted to sites having the longest fully overlapping observation period with no gap, leading to time series of 5, 12, and 11 years, for bats, birds, and butterflies,
respectively. This last data selection procedure reduced the number of sites included to 87, 106, and 57, for bats, birds, and butterflies, respectively (Dataset 3). The analysis of the
three datasets gave qualitatively similar results (Supplementary Figs. 7–9), confirming the robustness of our results to both the presence of gaps and the number of communities studied.
COMMUNITY SPECIES DIVERSITY AND PHYLOGENETIC DIVERSITY For each local community, we estimated the species diversity as the exponential of the Shannon diversity index calculated from the
summed yearly abundance across all years for each species seen in a site during the survey period. We assessed the phylogenetic diversity of each community using the MPD index weighted by
species abundances49. As the weighted MPD was correlated to species diversity for the three taxa, all analyses were performed using the residuals of the weighted MPD against the species
diversity (Supplementary Fig. 10). The weighted MPD calculations were based on ultrametric molecular phylogenetic trees50. For bats we used the phylogenetic tree provided by Shi and
Raboski51 (Supplementary Fig. 11). For birds we extracted 1000 trees from the phylogeny published by Jetz et al.52 and computed the Maximum Clade Credibility tree with branch lengths equal
to the median of the branch lengths of the 1000 trees using TreeAnnotator 1.7.553 and without burnin. The resulting tree was well supported, with 93% of the nodes having a Bayesian Posterior
Probability > 0.9 (Supplementary Fig. 12). For butterflies, we downloaded published sequences for the following genes: cytochrome oxidase c subunit 1 (COI, 657 bp), elongation factor 1
alpha (EF1_α_, 1239 bp), glyceraldehyde 3-phosphate dehydrogenase (GAPDH, 690 bp), ribosomal protein S5 (RPS5, 616 bp), wingless (wg, 402 bp) (Supplementary Table 4). Sequences were aligned
using CodonCode Aligner 6.0.2 [http://www.codoncode.com], and the different genes were concatenated. Phylogenetic analyses were performed in a Bayesian framework using BEAST 1.8.1. The
dataset was partitioned by gene. Unlinked GTR + Γ model of nucleotide substitution and uncorrelated lognormal clocks were implemented for all partitions. The MCMC analysis was run for 100
million generations, and sampled every 100,000 generation, which resulted in 1000 trees. After checking for convergence, we applied a 10% burnin and extracted the Maximum Clade Credibility
tree with branch lengths equal to the median of those of all trees using Tree Annotator 1.7.553. Because in preliminary runs Papilionoideae monophyly was not recovered (basal relationships
were poorly resolved), we enforced monophyly for this group. The MCC tree where Papilionoideae monophyly was enforced was well resolved, with all Bayesian posterior probabilities > 0.99
(Supplementary Fig. 13). To assess the robustness of our results to the use of diversity metrics weighted by species abundances we also calculated the species richness as the total number of
species seen during the survey period, and the corresponding Chao index54 to account for imperfect detections (Supplementary Fig. 14) with R package “vegan”55. Similarly, we calculated the
MPD not accounting for species abundances. For similar reason as for the weighted diversity metric, analysis were performed with the residuals of MPD against species richness or Chao index.
The use of either species richness estimates coupled with unweighted MPD residuals did not change qualitatively the results from the ones obtained using the Shannon diversity index and the
residual weighted MPD (Supplementary Figs. 7–9). We present in the main text the analysis using the diversity metrics weighted by species abundances. TEMPORAL STABILITY AND ASYNCHRONY
MEASURES To investigate the mechanisms by which habitat degradation and community diversity might affect the stability of local communities, we calculated the temporal stability of each of
these communities as the inverse of the coefficient of variation of the community abundance across time. The temporal stability of a community abundance decreases when the coefficient of
variation of the community abundance increases. To quantify the respective contribution of population asynchrony and stability to community stability, we followed Thibaut and Connolly22 and
partitioned the coefficient of variation of community abundance CV into the product of an index of population synchrony \(\varphi\) developed by Loreau and de Mazancourt56 and the mean
coefficient of variation of the population abundance (mean population variability) weighted by their relative abundances \(\overline {{\mathrm{CV}}_w}\) as: $${\mathrm{CV}} = \overline
{{\mathrm{CV}}_w} {\times} {\sqrt{(\varphi)}}.$$ (1) with $$\overline {{\mathrm{CV}}_w} = \mathop {\sum }\limits_i \frac{{\mu _i}}{\mu }\frac{{\sigma _i}}{{\mu _i}} = \mathop {\sum
}\limits_i \frac{{\mu _i}}{\mu }{\mathrm{CV}}_i,$$ (2) and $$\varphi = \frac{{\sigma ^2}}{{(\mathop {\sum }\nolimits_i \sigma _i)^2}}.$$ (3) With _σ_2 representing the variance of the
abundance of the community, _σ__i_ the standard deviation of the abundance of the population _i_ in the community, _µ_ the temporal mean of the abundance of the community, _µ__i_ the
temporal mean of the abundance of the population _i_ and CV_i_ the coefficient of variation of the abundance of population _i_. The population synchrony index \(\varphi\) ranges from 0
(maximum asynchrony) to 1 (maximum synchrony). To get an asynchrony index that increases with population asynchrony, and population and community indices that increase with population and
community stability, respectively, we used the inverses of the synchrony index and of the weighted mean coefficient of variation of population abundance. To achieve normality, we
log-transformed the coefficient of variation of community, the coefficient of variation of population and the synchrony index for the three taxa. We always have
$${\mathrm{Community}}\,{\mathrm{stability}} = 1/2\,{\mathrm{population}}\,{\mathrm{asynchrony}} + {\mathrm{weighted}}\,{\mathrm{mean}}\,{\mathrm{population}}\,{\mathrm{stability}},$$ (4)
where $${\mathrm{Community}}\,{\mathrm{stability}} = - {\mathrm{log(CV)}},$$ (5) $${\mathrm{Population}}\,{\mathrm{asynchrony}} = - {\mathrm{log}}(\varphi ),$$ (6)
$${\mathrm{Weighted}}\,{\mathrm{mean}}\,{\mathrm{population}}\,{\mathrm{stability}} = - {\mathrm{log}}(\overline {{\mathrm{CV}}_w} ).$$ (7) ASSESSING HABITAT DEGRADATION To characterize and
quantify habitat degradation levels around the monitoring sites, we first used Corine Land Cover [https://www.data.gouv.fr/fr/datasets/corine-land-cover-occupation-des-sols-en-france/] to
quantify the percentages of cover occupied by five land-use categories within buffers surrounding the study sites: urban, cropland, heterogeneous agriculture, woodland and seminatural open
areas (Supplementary Table 5). To calculate the percentage of cover associated to each of our landscape variables around each study site, we used 3 buffer sizes per taxa: buffers of radius
250, 500, and 1000 m around the transect for bat and around the garden for butterfly communities, and squares of 2, 2.5, and 3 km of side for bird communities. These differences in size and
shape among taxa accommodate for the shape of the sampled area and the scale at which landscape is known to affect those taxa44,57,58. The use of either of the three buffer sizes in our
statistical analyses (see below) did not change qualitatively our results (Supplementary Figs. 7–9). Second, to account for landscape complexity, we calculated a Shannon diversity index on
the area of each land-use category of the level 3 of Corine land cover (Supplementary Table 5). To account for potential changes in the landscape during the monitoring period, we averaged
the percentage areas and landscape complexity described above over the years available in the Corine land cover database that match the monitoring periods. For bird communities, we used the
land cover data for the years 2000, 2006, 2012, and 2018; for bat communities, the years 2006 and 2012; and for butterfly communities, the years 2006, 2012, and 2018. Third, to account for
the intensity of both urban and agricultural land uses, we calculated two indices. The area of sealed soil from the European Soil Sealing V2
[http://www.eea.europa.eu/data-and-maps/explore-interactive-maps/european-soil-sealing-v2] (hereafter, sealed soil) that is only available for the year 2006, and an index of agricultural
practice intensity (hereafter, agricultural inputs) following the European Union agri-environmental indicator of intensification-extensification
[http://ec.europa.eu/eurostat/statistics-explained/index.php/Agri-environmental_indicator_-_intensification_-_extensification]. This last indicator is defined as the sum of expenses in k€
for fertilizers, pesticides, livestock food and veterinarian medics per year divided by the area of agricultural land. It was calculated for each year and administrative region using data
from the Agricultural Network of Account Information (RICA) [http://agreste.agriculture.gouv.fr/enquetes/reseau-d-information-comptable/]. This indicator is available for all years except
2017 and 2018. For each site, we calculated the mean over the monitoring period. We then performed a principal component analysis (PCA) on these eight landscape variables calculated for each
monitored site, followed by a Varimax rotation59 to ease the interpretation. The two first dimensions were used to characterize habitat degradation by an urban gradient and an agricultural
intensity gradient, the two being independent from each other (Fig. 2). To achieve normality for the following analysis, we log-transformed the urban gradient for the three taxa. The PCA was
performed twice, once for the Dataset 1 and 2 and once for the Dataset 3 (Supplementary Fig. 15) as the sites included differ between both. STATISTICAL ANALYSIS To assess the relationship
between habitat degradation gradients and community stability, we first fitted for each taxonomic group (1) a linear model with the two habitat degradation gradient as explanatory variables
(Fig. 3a, b), (2) a linear model with the species diversity and the phylogenetic diversity as explanatory variables (Fig. 3c, d). To quantify the direct and indirect effects of habitat
degradation gradients on community stability, SEM was performed in the following two steps: First, for each taxonomic group and related buffer sizes, we built a set of five linear models to
assess the effects of urban and agricultural intensity gradients on species diversity (model 1) and phylogenetic diversity (model 2), the effects of urban gradient, agricultural intensity
gradient, species diversity and phylogenetic diversity on population stability (model 3) and asynchrony (model 4), and the effects of the population stability and asynchrony on community
stability (model 5). Second, to disentangle direct and indirect relationships among variables, and compare the strength of significant relationships, we conducted piecewise SEM60 for each
taxonomic group and related buffer sizes. We used Shipley’s test of d-separation to assess the overall fit of the SEM61. The strength of a path from a variable on another is the product of
the strength of each significant relationship along the path. The overall effect of a variable on another one is the sum of the paths joining the two variables. For each taxon, the analysis
presented in the main text correspond to that performed with the buffer size leading to the lowest AIC. All results remain qualitatively similar for all scales (Supplementary Figs. 7–9). For
all statistical analyses, spatial autocorrelation was accounted for. For bird and butterfly communities we used generalized least squares with exponential and gaussian spatial correlation
structures respectively62. Because bat communities were aggregated in two distinct geographical regions, we used linear mixed-models with region as random effect (Ile-de-France or Manche)62.
To further our understanding of the effect of habitat degradation on population stability, we estimated the mean-variance scaling for each taxon by performing a linear mixed-model
explaining the log of the variance of population abundances by the log of the mean population abundances, with both species and site as a random effect. We found a slope of 1.61 ± 0.029 for
bats, 1.09 ± 0.004 for birds, and 1.09 ± 0.018 for butterflies, meaning that the stability of communities increases with the mean population abundance of the communities22. We verified these
predictions by looking at the relationships between the weighted mean population stability and the mean population abundance for each taxon using linear models identical to those used in
the path analyses (Supplementary Fig. 5). In addition, we tested whether habitat degradation gradients were correlated to either the mean population abundance of the communities or its
standard deviation (Supplementary Fig. 4). Statistical analyses were performed using the R software63, with libraries “PiecewiseSEM v1.2.0”60, “nlme”64, “picante”65, “ape”66, “ade4”67, and
“lmerTest”68. REPORTING SUMMARY Further information on research design is available in the Nature Research Reporting Summary linked to this article. DATA AVAILABILITY The datasets that
support the findings of this study are available in Zenodo with the identifier [https://doi.org/10.5281/zenodo.3736101]. Community raw data come from citizen science programs hosted by the
Vigie Nature program [http://vigienature.mnhn.fr/]. For bats we used the French bat-monitoring program [http://www.vigienature.fr/fr/chauves-souris]. For birds we used the French Breeding
Bird Survey [http://www.vigie-plume.fr/]. For butterflies we used the French garden butterfly observatory [http://www.vigienature.fr/fr/operation-papillons]. Data used to compute land-use
areas and landscape complexity are available on the Corine Land Cover website [https://www.data.gouv.fr/fr/datasets/corine-land-cover-occupation-des-sols-en-france/]. Data used to compute
sealed soil area are available on the EEA website [http://www.eea.europa.eu/data-and-maps/explore-interactive-maps/european-soil-sealing-v2]. Data used to compute the agricultural inputs are
available on the AGRESTE website [http://agreste.agriculture.gouv.fr/enquetes/reseau-d-information-comptable/]. CODE AVAILABILITY All codes used during the current study are available in
Zenodo with the identifier [https://doi.org/10.5281/zenodo.3736101]. REFERENCES * Wardle, D. A. et al. Drivers of inter-year variability of plant production and decomposers across
contrasting island ecosystems. _Ecology_ 93, 521–531 (2012). Article PubMed Google Scholar * Cardinale, B. J. et al. Biodiversity loss and its impact on humanity. _Nature_ 486, 59–67
(2012). Article ADS CAS PubMed Google Scholar * McCann, K. S. The diversity–stability debate. _Nature_ 405, 228–233 (2000). Article CAS PubMed Google Scholar * Tilman, D., Reich, P.
B. & Knops, J. M. H. Biodiversity and ecosystem stability in a decade-long grassland experiment. _Nature_ 441, 629–632 (2006). Article ADS CAS PubMed Google Scholar * Hector, A. et
al. General stabilizing effects of plant diversity on grassland productivity through population asynchrony and overyielding. _Ecology_ 91, 2213–2220 (2010). Article CAS PubMed Google
Scholar * Gross, K. et al. Species richness and the temporal stability of biomass production: a new analysis of recent biodiversity experiments. _Am. Naturalist_ 183, 1–12 (2014). Article
Google Scholar * Hautier, Y. et al. Anthropogenic environmental changes affect ecosystem stability via biodiversity. _Science_ 348, 336–340 (2015). Article ADS CAS PubMed Google Scholar
* Xu, Z. et al. Environmental changes drive the temporal stability of semi-arid natural grasslands through altering species asynchrony. _J. Ecol._ 103, 1308–1316 (2015). Article Google
Scholar * Hallett, L. M. et al. Biotic mechanisms of community stability shift along a precipitation gradient. _Ecology_ 95, 1693–1700 (2014). Article PubMed Google Scholar * Zhang, Y.
et al. Nitrogen enrichment weakens ecosystem stability through decreased species asynchrony and population stability in a temperate grassland. _Glob. Change Biol._ 22, 1445–1455 (2016).
Article ADS Google Scholar * Hautier, Y. et al. Eutrophication weakens stabilizing effects of diversity in natural grasslands. _Nature_ 508, 521–525 (2014). Article ADS CAS PubMed
Google Scholar * Grman, E., Lau, J. A., Schoolmaster, D. R. Jr. & Gross, K. L. Mechanisms contributing to stability in ecosystem function depend on the environmental context. _Ecol.
Lett._ 13, 1400–1410 (2013). Article Google Scholar * Ives, A. R. & Carpenter, S. R. Stability and diversity of ecosystems. _Science_ 317, 58–62 (2007). Article ADS CAS PubMed
Google Scholar * Newbold, T. et al. Global effects of land use on local terrestrial biodiversity. _Nature_ 520, 45–50 (2015). Article ADS CAS PubMed Google Scholar * Blüthgen, N. et
al. Land use imperils plant and animal community stability through changes in asynchrony rather than diversity. _Nat. Commun._ 7, 10697 (2016). Article ADS PubMed PubMed Central CAS
Google Scholar * Oliver, T., Roy, D. B., Hill, J. K., Brereton, T. & Thomas, C. D. Heterogeneous landscapes promote population stability. _Ecol. Lett._ 13, 473–484 (2010). Article
PubMed Google Scholar * Boyles, J. G., Cryan, P. M., McCracken, G. F. & Kunz, T. H. Economic importance of bats in agriculture. _Science_ 332, 41–42 (2011). Article ADS PubMed
Google Scholar * Şekercioğlu, Ç. H., Daily, G. C. & Ehrlich, P. R. Ecosystem consequences of bird declines. _Proc. Natl Acad. Sci. USA_ 101, 18042–18047 (2004). Article ADS PubMed
CAS PubMed Central Google Scholar * Jennersten, O. Flower visitation and pollination efficiency of some North European butterflies. _Oecologia_ 63, 80–89 (1984). Article ADS PubMed
Google Scholar * Cadotte, M. W., Dinnage, R. & Tilman, D. Phylogenetic diversity promotes ecosystem stability. _Ecology_ 93, S223–S233 (2012). Article Google Scholar * Venail, P. et
al. Species richness, but not phylogenetic diversity, influences community biomass production and temporal stability in a re-examination of 16 grassland biodiversity studies. _Funct. Ecol._
29, 615–626 (2015). Article Google Scholar * Thibaut, L. M. & Connolly, S. R. Understanding diversity–stability relationships: towards a unified model of portfolio effects. _Ecol.
Lett._ 16, 140–150 (2013). Article PubMed Google Scholar * Inchausti, P. & Halley, J. On the relation between temporal variability and persistence time in animal populations. _J.
Anim. Ecol._ 72, 899–908 (2003). Article Google Scholar * Yachi, S. & Loreau, M. Biodiversity and ecosystem productivity in a fluctuating environment: the insurance hypothesis. _Proc.
Natl Acad. Sci. USA_ 96, 1463–1468 (1999). * Elmqvist, T. et al. Response diversity, ecosystem change, and resilience. _Front. Ecol. Environ._ 1, 488–494 (2003). Article Google Scholar *
Loreau, M. & de Mazancourt, C. Biodiversity and ecosystem stability: a synthesis of underlying mechanisms. _Ecol. Lett._ 16, 106–115 (2013). Article PubMed Google Scholar *
Ruokolainen, L., Lindén, A., Kaitala, V. & Fowler, M. S. Ecological and evolutionary dynamics under coloured environmental variation. _Trends Ecol. Evol._ 24, 555–563 (2009). Article
PubMed Google Scholar * Thébault, E. & Loreau, M. The relationship between biodiversity and ecosystem functioning in food webs. _Ecol. Res._ 21, 17–25 (2006). Article Google Scholar
* Jiang, L., Pu, Z., Rossberg, A. E. A. G. & DeAngelis, E. D. L. Different effects of species diversity on temporal stability in single‐trophic and multitrophic communities. _Am. Nat._
174, 651–659 (2009). Article PubMed Google Scholar * Tanentzap, A. J. & Lee, W. G. Evolutionary conservatism explains increasing relatedness of plant communities along a flooding
gradient. _N. Phytol._ 213, 634–644 (2017). Article Google Scholar * Paradis, E., Baillie, S. R., Sutherland, W. J. & Gregory, R. D. Spatial synchrony in populations of birds: effects
of habitat, population trend, and spatial scale. _Ecology_ 81, 2112–2125 (2000). Article Google Scholar * Kilpatrick, A. M. & Ives, A. R. Species interactions can explain Taylor’s
power law for ecological time series. _Nature_ 422, 65–68 (2003). Article ADS CAS PubMed Google Scholar * Deguines, N., Julliard, R., Flores, Mde & Fontaine, C. The whereabouts of
flower visitors: contrasting land-use preferences revealed by a country-wide survey based on citizen science. _PLoS ONE_ 7, e45822 (2012). Article ADS CAS PubMed PubMed Central Google
Scholar * Flynn, D. F. B. et al. Loss of functional diversity under land use intensification across multiple taxa. _Ecol. Lett._ 12, 22–33 (2009). Article PubMed Google Scholar *
Meynard, C. N. et al. Beyond taxonomic diversity patterns: how do α, β and γ components of bird functional and phylogenetic diversity respond to environmental gradients across France? _Glob.
Ecol. Biogeogr._ 20, 893–903 (2011). Article Google Scholar * Kocher, S. D. & Williams, E. H. The diversity and abundance of north american butterflies vary with habitat disturbance
and geography. _J. Biogeogr._ 27, 785–794 (2000). Article Google Scholar * McKinney, M. L. Effects of urbanization on species richness: a review of plants and animals. _Urban Ecosyst._ 11,
161–176 (2008). Article Google Scholar * Sol, D., Bartomeus, I., González-Lagos, C. & Pavoine, S. Urbanisation and the loss of phylogenetic diversity in birds. _Ecol. Lett._ 20,
721–729 (2017). Article PubMed Google Scholar * Burel, F. et al. Comparative biodiversity along a gradient of agricultural landscapes. _Acta Oecol._ 19, 47–60 (1998). Article ADS Google
Scholar * Pimm, S. L. & Redfearn, A. The variability of population densities. _Nature_ 334, 613–614 (1988). Article ADS Google Scholar * Cyr, H. Does inter-annual variability in
population density increase with time? _Oikos_ 79, 549–558 (1997). Article Google Scholar * Inchausti, P. & Halley, J. The long-term temporal variability and spectral colour of animal
populations. _Evol. Ecol. Res._ 4, 1033–1048 (2002). Google Scholar * Fontaine, B., Bergerot, B., Viol, I. L. & Julliard, R. Impact of urbanization and gardening practices on common
butterfly communities in France. _Ecol. Evol._ 6, 8174–8180 (2016). Article PubMed PubMed Central Google Scholar * Azam, C., Le Viol, I., Julien, J.-F., Bas, Y. & Kerbiriou, C.
Disentangling the relative effect of light pollution, impervious surfaces and intensive agriculture on bat activity with a national-scale monitoring program. _Landsc. Ecol._ 31, 2471–2483
(2016). Article Google Scholar * Burt J. Syrinx a software for real time spectrographic recording, analysis and playback of sound. (2006) Available from:
http://www.vigienature.fr/fr/page/documentations-logiciel. * Kerbiriou, C. et al. Common bats are more abundant within Natura 2000 areas. _Biol. Conserv._ 217, 66–74 (2018). Article Google
Scholar * Jiguet, F., Devictor, V., Julliard, R. & Couvet, D. French citizens monitoring ordinary birds provide tools for conservation and ecological sciences. _Acta Oecol._ 44, 58–66
(2012). Article ADS Google Scholar * Muratet, A. & Fontaine, B. Contrasting impacts of pesticides on butterflies and bumblebees in private gardens in France. _Biol. Conserv._ 182,
148–154 (2015). Article Google Scholar * Cadotte, M. W. et al. Phylogenetic diversity metrics for ecological communities: integrating species richness, abundance and evolutionary history.
_Ecol. Lett._ 13, 96–105 (2010). Article PubMed Google Scholar * Webb, C. O., Ackerly, D. D., McPeek, M. A. & Donoghue, M. J. Phylogenies and community ecology. _Annu. Rev. Ecol.
Syst._ 33, 475–505 (2002). Article Google Scholar * Shi, J. J. & Rabosky, D. L. Speciation dynamics during the global radiation of extant bats. _Evolution_ 69, 1528–1545 (2015).
Article PubMed Google Scholar * Jetz, W., Thomas, G. H., Joy, J. B., Hartmann, K. & Mooers, A. O. The global diversity of birds in space and time. _Nature_ 491, 444–448 (2012).
Article ADS CAS PubMed Google Scholar * Rambaut, A. & Drummond, A. J. _TreeAnnotator_. (Computer Program and Documentation Distributed by the Author, 2012). * Chao, A., Chazdon, R.
L., Colwell, R. K. & Shen, T.-J. A new statistical approach for assessing similarity of species composition with incidence and abundance data. _Ecol. Lett._ 8, 148–159 (2005). Article
Google Scholar * Oksanen, J., Blanchet, F.G., Friendly, M., Kindt, R., Legendre, P., McGlinn, D., et al. vegan: Community Ecology Package. R package version 2.5-6.
https://CRAN.R-project.org/package=vegan (2019). * Loreau, M. & de Mazancourt, C. Species synchrony and its drivers: neutral and nonneutral community dynamics in fluctuating
environments. _Am. Nat._ 72, E48–E66 (2008). Article Google Scholar * Devictor, V. & Jiguet, F. Community richness and stability in agricultural landscapes: the importance of
surrounding habitats. _Agric. Ecosyst. Environ._ 120, 179–184 (2007). Article Google Scholar * Flick, T., Feagan, S. & Fahrig, L. Effects of landscape structure on butterfly species
richness and abundance in agricultural landscapes in eastern Ontario, Canada. _Agric. Ecosyst. Environ._ 156, 123–133 (2012). Article Google Scholar * Kaiser, H. F. The varimax criterion
for analytic rotation in factor analysis. _Psychometrika_ 23, 187–200 (1958). Article MATH Google Scholar * Lefcheck Jonathan, S. & Freckleton, R. piecewiseSEM: Piecewise structural
equation modelling in r for ecology, evolution, and systematics. _Methods Ecol. Evol._ 7, 573–579 (2015). Article Google Scholar * Shipley, B. Confirmatory path analysis in a generalized
multilevel context. _Ecology_ 90, 363–368 (2009). Article PubMed Google Scholar * Zuur, A. F., Ieno, E. N., Walker, N. J., Saveliev, A. A. & Smith, G. M. _Mixed Effects Models and
Extensions in Ecology with R_. (Springer, 2009). * R Core Team. _R: A Language and Environment for Statistical Computing_. (R Foundation for Statistical Computing, 2013). * Pinheiro J.,
Bates D., DebRoy S., Sarkar D. & R Core Team. __nlme: Linear and Nonlinear Mixed Effects Models__. (2016). * Kembel, S. W. et al. Picante: R tools for integrating phylogenies and
ecology. _Bioinformatics_ 26, 1463–1464 (2010). Article CAS PubMed Google Scholar * Paradis, E., Claude, J. & Strimmer, K. APE: analyses of phylogenetics and evolution in R language.
_Bioinformatics_ 20, 289–290 (2004). Article CAS PubMed Google Scholar * Dray, S. & Dufour, A. B. The ade4 package: implementing the duality diagram for ecologists. _J. Stat.
Softw._ 22, 1–20 (2007). Article Google Scholar * Kuznetsova, A., Brockhoff, P. B. & Christensen, R. H. B. _lmerTest: Tests in Linear Mixed Effects Models_. (2016). Download references
ACKNOWLEDGEMENTS We thank Frédéric Jiguet, Christian Kerbiriou, and Jean-François Julien for sharing their knowledge on birds and bats; Claire de Mazancourt, Martin Jeanmougin, Emmanuelle
Porcher, and Sonia Kéfi for insightful discussions and Alexandre Robert for drawing the animal motifs. Most importantly, we thank all the volunteers who contributed to the citizen science
programs STOC-EPS, Vigie-Chiro, and Opération Papillons, run by Vigie-Nature, Ligue pour la Protection des Oiseaux, and Noé Conservation. T.O. was supported with a fellowship by the Chaire
“Modélisation Mathématique et Biodiversité” of Veolia Environnement—École Polytechnique—Museum national d’Histoire naturelle—Fondation X, E.T. and C.F. were funded by the ANR project ECOSTAB
(ANR-17-CE32-0002/ECOSTAB). AUTHOR INFORMATION AUTHORS AND AFFILIATIONS * Centre d’Ecologie et des Sciences de la Conservation, UMR 7204 MNHN-CNRS-Sorbonne Université, Muséum national
d’Histoire naturelle de Paris, 43 rue Buffon, 75005, Paris, France Théophile Olivier, Benoit Fontaine & Colin Fontaine * Sorbonne Université, CNRS, IRD, INRAE, Université Paris Est
Créteil, Institute of Ecology and Environmental Sciences of Paris (iEES-Paris), Paris, France Elisa Thébault * Institut de Systématique, Evolution, Biodiversité, MNHN-CNRS-Sorbonne
Université-EPHE-Université des Antilles, Muséum national d’Histoire naturelle de Paris, 43 Rue Buffon, 75005, Paris, France Marianne Elias Authors * Théophile Olivier View author
publications You can also search for this author inPubMed Google Scholar * Elisa Thébault View author publications You can also search for this author inPubMed Google Scholar * Marianne
Elias View author publications You can also search for this author inPubMed Google Scholar * Benoit Fontaine View author publications You can also search for this author inPubMed Google
Scholar * Colin Fontaine View author publications You can also search for this author inPubMed Google Scholar CONTRIBUTIONS T.O., E.T., M.E., B.F., and C.F. designed the study and analyzed
the results; T.O. managed the datasets; M.E. built the butterfly and the bird phylogenetic trees; T.O., E.T., M.E., B.F., and C.F. participated in writing. CORRESPONDING AUTHOR
Correspondence to Théophile Olivier. ETHICS DECLARATIONS COMPETING INTERESTS The authors declare no competing interests. ADDITIONAL INFORMATION PEER REVIEW INFORMATION _Nature
Communications_ thanks Matthew Helmus and the other, anonymous, reviewer(s) for their contribution to the peer review of this work. Peer reviewer reports are available. PUBLISHER’S NOTE
Springer Nature remains neutral with regard to jurisdictional claims in published maps and institutional affiliations. SUPPLEMENTARY INFORMATION SUPPLEMENTARY INFORMATION PEER REVIEW FILE
REPORTING SUMMARY RIGHTS AND PERMISSIONS OPEN ACCESS This article is licensed under a Creative Commons Attribution 4.0 International License, which permits use, sharing, adaptation,
distribution and reproduction in any medium or format, as long as you give appropriate credit to the original author(s) and the source, provide a link to the Creative Commons license, and
indicate if changes were made. The images or other third party material in this article are included in the article’s Creative Commons license, unless indicated otherwise in a credit line to
the material. If material is not included in the article’s Creative Commons license and your intended use is not permitted by statutory regulation or exceeds the permitted use, you will
need to obtain permission directly from the copyright holder. To view a copy of this license, visit http://creativecommons.org/licenses/by/4.0/. Reprints and permissions ABOUT THIS ARTICLE
CITE THIS ARTICLE Olivier, T., Thébault, E., Elias, M. _et al._ Urbanization and agricultural intensification destabilize animal communities differently than diversity loss. _Nat Commun_ 11,
2686 (2020). https://doi.org/10.1038/s41467-020-16240-6 Download citation * Received: 03 June 2019 * Accepted: 16 April 2020 * Published: 01 June 2020 * DOI:
https://doi.org/10.1038/s41467-020-16240-6 SHARE THIS ARTICLE Anyone you share the following link with will be able to read this content: Get shareable link Sorry, a shareable link is not
currently available for this article. Copy to clipboard Provided by the Springer Nature SharedIt content-sharing initiative
Trending News
410 Deleted by author — MediumSitemapOpen in app Sign upSign inMedium LogoWrite Sign upSign inError410The author deleted this Medium story....
Volunteer driven by love of reading and her communityMy parents loved to read. Our library in Elkhart, Indiana, had a program where each child received a tracking page to se...
‘i played bad classical music because the male composer was famous’Can you name five male composers? Most likely, yes: Bach, Mozart, Beethoven, Schubert, Brahms. Can you name five female ...
Meet the 17-year-old who's already got a three-book deal with random houseThis article is from the archive of our partner . Beth Reekles is the 17-year-old Welsh high school student who posted h...
Kate mulgrew describes care of ailing parents in memoirAFTER GETTING HIS TERMINAL CANCER DIAGNOSIS, YOUR FATHER TURNED TO HIS DOCTOR AND SAID: “NOT A LOT OF LAUGHS IN YOUR LIN...
Latests News
Urbanization and agricultural intensification destabilize animal communities differently than diversity lossABSTRACT Despite growing concern over consequences of global changes, we still know little about potential interactive e...
Carnegie Endowment for International Peace | Carnegie Endowment for International PeaceGlobal LocationsresearchemissaryaboutexpertsmoresupportprogramseventsblogspodcastsvideosNewslettersAnnual Reportscareers...
How mcdonald’s, likely new ligue 1 football sponsor, won over franceADAPTING TO FRENCH CULTURE HELPED MAKE BURGER CHAIN BIGGEST IN COUNTRY Fast food giant McDonald’s is primed to claim the...
Scott mctominay's 15-word statement shows huge problem man utd haveFORMER MANCHESTER UNITED MIDFIELDER SCOTT MCTOMINAY HAS PROVEN THE GRASS CAN BE GREENER WITH HIS MOVE TO NAPOLI, AND THE...
Sikkim assembly nod to 2 new districtsGangtok: On the third and final day of the Fifth Session of the 10th Assembly, the Sikkim Legislative Assembly voted for...