Cephalopod-inspired optical engineering of human cells
Cephalopod-inspired optical engineering of human cells"
- Select a language for the TTS:
- UK English Female
- UK English Male
- US English Female
- US English Male
- Australian Female
- Australian Male
- Language selected: (auto detect) - EN
Play all audios:
ABSTRACT Although many animals have evolved intrinsic transparency for the purpose of concealment, the development of dynamic, that is, controllable and reversible, transparency for living
human cells and tissues has remained elusive to date. Here, by drawing inspiration from the structures and functionalities of adaptive cephalopod skin cells, we design and engineer human
cells that contain reconfigurable protein-based photonic architectures and, as a result, possess tunable transparency-changing and light-scattering capabilities. Our findings may lead to the
development of unique biophotonic tools for applications in materials science and bioengineering and may also facilitate an improved understanding of a wide range of biological systems.
SIMILAR CONTENT BEING VIEWED BY OTHERS BIOINSPIRED DYNAMIC COLOUR CHANGE Article 27 March 2025 DYNAMIC SPATIO-TEMPORAL CONTROL OF NATURALLY SOURCED SOFT PHOTONIC CRYSTALS Article Open access
07 November 2022 SELF-GROWING PHOTONIC COMPOSITES WITH PROGRAMMABLE COLORS AND MECHANICAL PROPERTIES Article Open access 19 December 2022 INTRODUCTION The idea of humans vanishing from
sight by becoming transparent or invisible has captivated the imaginations of the general populace and scientists alike for millennia. These concepts have been described in classic
literature by various authors, including the philosopher Plato, who conceived the Ring of Gyges as a hypothetical item that would allow its wearer to disappear1, and the writer H. G. Wells,
who envisioned that a scientist could match their refractive index to that of air in order to become invisible2. Although such notions may seem fantastic at first glance, the natural world
is filled with examples of animals, such as the glasswing butterfly3, the grass shrimp4, the comb jellyfish5, the glass frog6, and mesopelagic cephalopods7, which have evolved transparent
structures, tissues, or even whole bodies for the purpose of concealment8,9. From a technological perspective, the study of transparency (defined as the property of transmitting light
without appreciable scattering such that objects lying beyond can be seen clearly) has recently attracted significant attention. This renewed interest in transparency has been motivated by
the emergence of laboratory techniques for making deceased mammalian tissues/organs optically clear and thus amenable to three-dimensional visualization10,11. In this regard, whether in
nature or in the laboratory, static transparency for biological systems has been typically achieved in the same way—by maximizing the direct transmission of visible light while
simultaneously minimizing competing processes, i.e. the absorption of light by biomolecules found in the system of interest and the scattering of light due to differences in refractive index
along its path8,9,10,11. However, technologically valuable methodologies for dynamically manipulating the transparency of living human cells and tissues have proven challenging to develop
and effectively remain confined to the realm of science fiction. In nature, adaptive transparency has been realized to some extent, with many cephalopods (i.e. octopuses, squids, and
cuttlefish) demonstrating remarkable camouflage capabilities and even performing literal vanishing acts12,13,14,15,16,17. Indeed, these animals can dynamically alter how their skin
transmits, absorbs, and reflects light through the functionality of unique natural optical components, which include pigmented organs called chromatophores, typically narrowband-reflecting
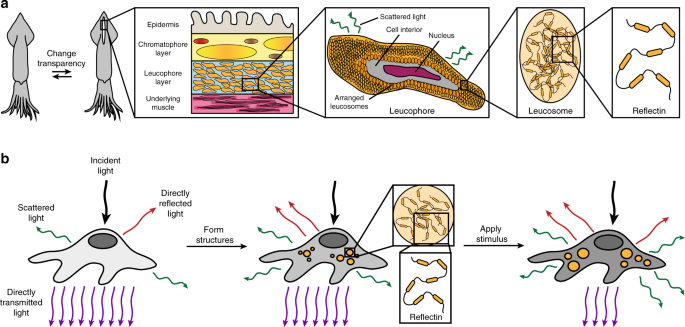
cells called iridophores, and broadband-reflecting cells called leucophores12,13,14,15,16,17. As one specific example, the female _Doryteuthis opalescens_ squid can avoid unwanted aggression
by switching a stripe on its mantle from nearly transparent (i.e. weakly scattering) to opaque white (i.e. strongly scattering) (Fig. 1a and Supplementary Fig. 1)17. This feat represents a
fascinating case study of adaptive biological optics and is thought to be achieved by means of a specialized layer that contains tunable leucophores (Fig. 1a and Supplementary Fig. 1)17.
Generally, in octopus and cuttlefish skin, leucophores encompass disordered arrangements of proteinaceous structures called leucosomes, which range in diameter from hundreds of nanometers to
several microns and can be membrane-bound or localized throughout the cells’ bodies (Supplementary Fig. 2)18,19,20. Such disordered leucosome arrangements (i.e. natural photonic
architectures) allow cuttlefish leucophores to diffusely reflect (i.e. scatter) incident visible light via a Mie-type mechanism and to therefore function as passive broadband reflectors that
produce bright white coloration18,19,20. In the female _D. opalescens_ squid’s mantle, the leucophores contain similar leucosome arrangements (Fig. 1a and Supplementary Fig. 2), but rather
than being passive, these cells are active, with broadband reflectances that can be reversibly modulated by injection of acetylcholine into the surrounding tissues (note that the exact
molecular mechanisms underpinning such tunability are not yet fully understood) (Supplementary Fig. 1)17. Accordingly, dynamic cephalopod leucophores and their constituent light-reflecting
photonic architectures constitute enticing archetypes for the design and engineering of other cellular systems with tunable optical properties. Many of the internalized photonic
architectures that enable the optical functionalities of cephalopod skin cells (including leucophores) are composed of proteins known as reflectins13,21,22. With a few exceptions,
reflectins’ amino acid sequences consist of variable linker regions that are separated by conserved motifs with the highly general form (M/F-D-X5)(M-D-X5)n(M-D-X3/4)13,21,22. These sequences
are unusual because they have a low percentage of common aliphatic amino acids, e.g. alanine, leucine, isoleucine, and a high percentage of aromatic amino acids, e.g. tyrosine and
tryptophan, while also being enriched in arginine, asparagine, and methionine13,21,22. This peculiar composition is thought to be directly responsible both for reflectins’ remarkably diverse
self-assembly properties13,22 and for their unusually high refractive indices23,24. In particular, reflectins not only form the spheroidal leucosomes found in leucophores19,20 and the
membrane-enclosed platelets found in iridophores25,26,27 in vivo, but they also readily assemble into nanoparticles24,28,29,30, microfibers24, hexagonal plates31, and thin
films13,24,32,33,34 in vitro. For some of these nano- and micro-structures, the application of different chemical stimuli can even modulate their aggregation state, e.g. NaCl and ionic
strength for the nanoparticles24,28, or lead to disassembly/reassembly, e.g. aromatic compounds for the hexagonal plates31. Furthermore, reflectin-based structures have been proven to
possess high refractive indices in varied contexts, with average values of ~1.44 reported for condensed platelets in squid iridophores27, ~1.51 observed for leucosomes in cuttlefish
leucophores19, and ~1.54 to ~1.59 measured for reflectin-based films on solid substrates24,32. Overall, this combination of characteristics has made reflectins attractive brick and mortar
materials for the design and construction of unique bioinspired optical systems. Herein, we draw inspiration from female _D. opalescens_ squids' leucophores and their constituent
reflectin-containing leucosome arrangements for the development and engineering of human cells with tunable optical properties. First, we conceptualize human cells that would contain
reconfigurable reflectin-based subcellular structures and, as a result, would possess stimuli-responsive transparency-changing capabilities. Next, we assemble and definitively characterize
the desired proteinaceous photonic architectures within human cells. In turn, we evaluate the effect of such architectures on the optical characteristics and functionalities of the
engineered cells. Last, we demonstrate that transmission and scattering of light by our cell cultures can be modulated with an external stimulus. Taken together, our findings may lead to the
development of unique biophotonic technologies and thus afford exciting scientific opportunities across biology, materials science, and bioengineering. RESULTS HUMAN CELLS WITH DESIGNER
OPTICAL PROPERTIES By drawing inspiration from cephalopod leucophores, we designed human cells that would contain stimuli-responsive photonic architectures and, as a consequence, would
possess the ability to change their appearance and transmission of light. Towards this end, we first selected human embryonic kidney (HEK) 293 cells as the platform for integration of such
architectures because these cells reliably express various recombinant proteins and can accumulate some foreign biomolecules within cytoplasmic inclusion bodies or phase-separated
aggregates35,36,37. We in turn selected the reflectin A1 (RfA1) isoform as the constituent material for our architectures because its homologues feature refractive indices that are among the
largest known for any protein23,27,32, assemble into a diverse array of ionic strength-responsive structures both in vitro and in squid skin cells17,24,25,26,28, and possess amino acid
sequences that differ dramatically from those of mammalian proteins (Supplementary Fig. 3). Having made these selections, we assumed that, before transfection, the initially transparent
native human cells would contain the usual mammalian organelles as their only subcellular structures and, therefore, would directly transmit most of the incident visible light with
relatively minimal scattering (Fig. 1b, left). However, we expected that, after transfection with a vector encoding for RfA1, the human cells would express this reflectin isoform in
reasonable quantities, assemble the foreign protein into leucosome-like cytoplasmic aggregates with unusually high local refractive indices, and then randomly distribute the aggregates in
disordered arrangements throughout the cells’ interiors (Fig. 1b, middle). As such, we speculated that the RfA1-expressing cells would now contain reflectin-based photonic architectures with
refractive indices that differ significantly from the surrounding cytoplasm and would consequently diffusely transmit and/or diffusely reflect (i.e. scatter) some of the incident visible
light, thereby making the cells less transparent in analogy to passive cuttlefish leucophores (Fig. 1b, middle). Furthermore, we postulated that, upon exposure to chemical stimuli known to
influence RfA1 assembly such as NaCl24,28, the RfA1-expressing cells would reconfigure the sizes, geometries, and/or arrangements of their internalized photonic architectures and would
diffusely transmit and/or diffusely reflect (i.e. scatter) a different amount of the incident visible light, thereby altering the cells’ transparency in analogy to tunable squid leucophores
(Fig. 1b, right). The overall approach would represent a powerful strategy for endowing living mammalian cells and tissues with tunable optical capabilities that emulate those reported for
cephalopod skin components. PROTEIN-BASED ARCHITECTURES IN HUMAN CELLS We began our studies by engineering human cells to produce large quantities of our squid protein. To this end, we grew
HEK 293 cells transfected with a vector encoding for the expression of histidine-tagged _Doryteuthis pealeii_ RfA1 and then visualized the fixed cells with immunofluorescence microscopy (see
Methods for details). Here, the overlaid fluorescence microscopy images of fixed RfA1-transfected cells stained with the nuclear marker 4′,6′-diamidino-2-phenylindole (DAPI) and
immunolabeled with an antibody pair specific for the proteins’s N-terminal histidine-tag revealed that the nuclei (colored blue) were surrounded by small reflectin aggregates (colored
green), suggesting the successful expression of our squid protein by most of the cells (Fig. 2a, left). Similarly, the overlaid fluorescence microscopy images of fixed RfA1-transfected cells
stained with DAPI, but now immunolabeled with an antibody pair specific for reflectins’ unique sequence, again, revealed that the nuclei (colored blue) were surrounded by reflectin
aggregates (colored green), corroborating the successful expression of the squid protein by most of the cells (Fig. 2a, right). In comparison, the analogous fluorescence microscopy images of
RfA1-transfected cells, for which immunolabeling was attempted with any member of the antibody pairs omitted, did not reveal any fluorescence signals (Supplementary Fig. 4). Furthermore,
the fluorescence microscopy images of the mock transfected cells (i.e. ones treated with the transfection reagents but not the RfA1 vector) and the untransfected cells, for both of which
immunolabeling was attempted with the reflectin-specific antibody pair, also did not reveal any fluorescence signals (Supplementary Figs. 5 and 6). These findings suggested that the
transfected cells successfully expressed the non-native reflectin and then localized the protein within punctate aggregates. We continued our studies by evaluating how the introduction of
our squid protein affected the growth of the engineered human cells. Thus, we again cultured HEK 293 cells transfected with a vector encoding for the expression of histidine-tagged RfA1,
initially visualized the live cells without any staining by using phase contrast microscopy, and then visualized both the live and fixed cells after staining with different markers by using
fluorescence microscopy (see Methods for details). First, the phase contrast microscopy images of live RfA1-transfected cells indicated that the cells featured slightly rounded morphologies,
whereas the analogous images of untransfected cells revealed typical spread-out morphologies (Supplementary Fig. 7). In addition, the fluorescence microscopy images of RfA1-transfected
cells stained with both the live cell-specific calcein AM fluorescent dye and the dead cell-specific ethidium homodimer-1 fluorescent dye revealed a viability of 97 (±2)% and a density of
2.1 (±0.2) × 105 cells per cm2, whereas the analogous images of live untransfected cells revealed an almost indistinguishable viability of 98 (±1)% and a slightly higher density of 2.8
(±0.4) × 105 cells per cm2 (Supplementary Fig. 8). Moreover, the fluorescence microscopy images of fixed RfA1-transfected cells stained with fluorophore-tagged wheat germ agglutinin revealed
areas of 338 (±50) µm2, whereas the analogous images of live untransfected cells revealed slightly larger areas of 375 (±50) µm2 (Supplementary Fig. 9). These experiments indicated that the
expression of the non-native reflectin somewhat altered the engineered cells’ morphologies and areas but did not significantly impact their overall health. Next, we proceeded to directly
characterize the squid protein-based aggregates formed within our engineered human cells. For this purpose, we prepared thin cross-sections from fixed, resin-embedded, RfA1-expressing cells,
and then imaged such cross-sections with transmission electron microscopy (TEM) (see the Methods for details). The TEM images obtained for multiple cellular cross-sections from
RfA1-expressing cells revealed the presence of distinct arrangements of intracellular structures with large sizes and high electron densities, which presumably consisted of RfA1 and were
found alongside the usual organelles, e.g. the nucleus, mitochondria, and ribosomes (Fig. 2b and Supplementary Fig. 10). These distinct arrangements routinely constituted >20% of the
cellular cross-sections’ areas and generally consisted of two types of structures: (1) spheroidal nanoparticles with diameters of ~50 to ~250 nm typically located in clusters within the
cells’ cytoplasm and (2) irregularly shaped nanostructures with diameters greater than ~250 nm often located closer to (or outside) the cells’ membranes and peripheries (Fig. 2b and
Supplementary Figs. 10 and 11). In comparison, the analogous TEM images of cross-sections prepared either from cells that were not transfected with RfA1 or from cells that expressed red
fluorescent protein (RFP), which can be aggregation-prone38, did not reveal structures resembling those found for the RfA1-expressing cells (Supplementary Figs. 12 and 13). Interestingly,
the TEM images suggested that the engineered cells sequestered RfA1 within spheroidal nanoparticles, coalesced such nanoparticles into irregularly shaped nanostructures, and even expelled
the larger structures into the surrounding environment. Together, these observations afforded detailed insight into the sizes, aggregation states, and subcellular distributions of the
reflectin-based structures within our cells. To better understand our squid protein’s subcellular localization, we investigated human cells that expressed not only histidine-tagged RfA1 but
also red fluorescent protein (RFP) as a distinct biomolecular reporter. To this end, we grew HEK 293 cells transfected with a vector encoding for the expression of both histidine-tagged RfA1
and RFP as independent unconnected proteins, with the latter’s expression mediated by an internal ribosome entry site (IRES). We subsequently visualized such live cells with phase contrast
and fluorescence microscopy and analogous fixed cells with immunofluorescence microscopy (see Methods for details). The overlaid phase contrast and fluorescence microscopy images of live
RfA1- and RFP-transfected cells indicated that nearly two thirds of them expressed RfA1, as gauged from the fraction of the cell population that exhibited red fluorescence associated with
the RFP reporter (Supplementary Fig. 14). The merged fluorescence microscopy images obtained for fixed RfA1- and RFP-expressing cells stained with DAPI and immunolabeled with an antibody
pair specific for reflectins’ sequence revealed that the nuclei (colored blue) were in close proximity to RfA1 aggregates (colored green) (Fig. 2c), in agreement with the comparable images
for the RfA1-expressing cells (Fig. 2a). The merged images obtained for RfA1- and RFP-expressing cells also revealed that the localized fluorescence from the immunolabeled RfA1-based
structures (colored green) did not precisely overlap with the more dispersed fluorescence from the independent RFP reporter proteins (colored red), suggesting that the two biomolecules were
distributed throughout the cells in different ways (Fig. 2c). In comparison, the analogous fluorescence microscopy images of fixed RfA1- and RFP-transfected cells, for which labeling was
attempted with either the primary or secondary member of the reflectin-specific antibody pair omitted, only revealed fluorescence signals associated with RFP but not with specific
immunolabeling (Supplementary Fig. 15). Overall, these findings further confirmed that our engineered human cells readily expressed reflectin in high yield and distributed this protein as
variable-sized aggregates throughout the cells’ interiors in unique fashion. We subsequently sought to unequivocally prove that the aggregates found within the engineered human cells were
formed from our squid protein. For this purpose, we first prepared ultra-thin cross-sections from fixed, cryoprotectant-treated RfA1- and RFP-expressing cells; immunolabeled the sections via
treatment with a primary antibody specific for reflectins’ sequence followed by a complementary secondary antibody conjugated to a gold nanoparticle; and then imaged the resulting labeled
sections with electron microscopy (immuno-EM) (see the Methods for details). The representative immuno-EM images of such cellular sections revealed the presence of clusters of electron-dense
structures (dark gray spheres) that were distributed throughout the cells’ interiors alongside the usual organelles, e.g. the nucleus (Fig. 2d). Such arrangements constituted a significant
fraction of the cross-sections’ areas (and, presumably, of the cellular volumes) and typically consisted of spheroidal structures with diameters of tens to hundreds of nanometers (Fig. 2d).
In general, the observed aggregates appeared similar in most respects, i.e. size, shape, location, and distribution, to those imaged with TEM not only in cells that expressed RfA1 (Fig. 2b
and Supplementary Fig. 10) but also in cells that expressed both RfA1 and RFP (Supplementary Fig. 16). Most importantly, higher-magnification immuno-EM images of the cellular sections showed
that our spheroidal structures were selectively labeled by the antibody-conjugated gold nanoparticles (small black dots), thus conclusively demonstrating that the structures consisted of
RfA1 (Fig. 2d). Interestingly, the assorted high-resolution immuno-EM and TEM images obtained for the RfA1-based structures (Fig. 2b, d, and Supplementary Figs. 10 and 16) were reminiscent
of classic and recent electron microscopy images of reflectin-based leucosomes from octopus, cuttlefish, and squid leucophores, although our structures’ size distributions differed somewhat
from those reported for cuttlefish leucosomes (Supplementary Figs. 2 and 11)17,18,19,20. Together, these observations definitively and unambiguously confirmed the formation of unique
arrangements of reflectin-based structures within our engineered human cells. OPTICAL CHARACTERISTICS OF THE ENGINEERED CELLS We proceeded to study whether the expression of the squid
protein modified our engineered human cell cultures’ interaction with light. Towards this end, we grew HEK 293 cells transfected with a vector encoding for the expression of histidine-tagged
RfA1 and then visualized the resulting cell cultures with reflection-mode low coherence quantitative phase microscopy (RLC-QPM) (see Fig. 3a and the Methods for details). This technique
measures how incident light changes its phase when reflected from various objects, such as living cells positioned on a substrate, and therefore enables the generation of phase images, which
quantitatively represent the observed phase shifts (see Fig. 3a and the Methods for details)39,40,41. Initially, the RLC-QPM images obtained for recently transfected cells, which did not
have enough time to express RfA1, showed that the cells had typical spread-out morphologies (Fig. 3a, left), in agreement with standard phase contrast microscopy imaging of untransfected
cells (Supplementary Fig. 7). The phase difference between the cells’ bodies (relatively dark gray areas) and the glass substrate (relatively light gray areas) was moderate, although the
bodies featured some regions with a greater phase difference (small gray-black spots) that likely corresponded to organelles (Fig. 3a, left), in agreement with TEM images of untransfected
cells (Supplementary Fig. 12). In comparison, the RLC-QPM images obtained for analogous cells that had been given sufficient time to express RfA1 showed that they now had slightly rounded
morphologies (Fig. 3a, right), in agreement with standard phase contrast microscopy imaging of RfA1-expressing cells (Supplementary Fig. 7). The phase difference between the cells’ bodies
(now even darker gray areas) and the glass substrate (relatively light gray areas) had become more pronounced, with the cell bodies featuring a substantial number of regions with a higher
phase difference (large dark black spots) that likely corresponded to RfA1-based nanostructures, in agreement with TEM images of RfA1-expressing cells (Fig. 2b and Supplementary Fig. 10).
These experiments showed that the formation of disordered arrangements of reflectin-based structures within our cells’ interiors altered the way in which they reflected light. Next, we
sought to explicitly quantify the effect of the squid protein on the optical characteristics (specifically, the refractive indices) of our engineered human cells. Thus, we grew cells
transfected with a vector encoding for the expression of both histidine-tagged RfA1 and the RFP reporter and, again, visualized the resulting cells with both RLC-QPM and fluorescence
microscopy (on a single instrument). Here, RLC-QPM facilitated recording of not only the phase images but also the corresponding optical pathlengths and geometric heights for different cells
before and after protein expression, subsequently enabling precise calculation and comparison of the cells’ refractive index maps (see the Methods for details)39,40,41. In tandem,
fluorescence microscopy provided verification of RfA1 expression via monitoring of the RFP reporter, making it possible to unambiguously differentiate between the RfA1-expressing and the
likely untransfected cells. At first, the RLC-QPM images of recently transfected cells, which were not yet expressing RfA1 and RFP, showed that the cells featured a relatively minimal phase
difference with the substrate (Fig. 3b, top left). The fluorescence microscopy images of the same cells did not reveal the presence of any RFP-associated fluorescence signals (Fig. 3b, top
middle). Furthermore, the corresponding cellular refractive index distribution was generally uniform with an average value of ~1.38 (Fig. 3b, top right), which matched literature precedent
for whole mammalian cells39,42,43. Subsequently, the RLC-QPM images of cells that had been given sufficient time to express RfA1 and RFP showed that some of the cells now featured a more
pronounced phase difference with the substrate, presumably due to the presence of RfA1-based structures (Fig. 3b, bottom left). The fluorescence microscopy images of the same cells revealed
that some of the cells exhibited clear RFP-associated fluorescence signals, confirming successful protein expression (Fig. 3b, bottom middle). Furthermore, the corresponding cellular
refractive index distributions were no longer uniform: the non-fluorescent cells, which had failed to express both RfA1 and RFP, retained an average refractive index of ~1.38, whereas the
fluorescent cells, which had successfully expressed both proteins, now featured an average refractive index of >~1.42 (Fig. 3b, bottom right). Notably, for measurements performed across
multiple cultures, the average refractive indices were consistently lower for the non-fluorescent (i.e. non-protein producing) cells and remained relatively unchanged for days, whereas the
average refractive indices were consistently higher for the fluorescent (i.e. protein producing) cells and remained relatively unchanged only after the emergence of fluorescence
(Supplementary Fig. 17). As might be expected, the RfA1- and RFP-expressing cells did exhibit some variability in their refractive index values, with more intense fluorescence signals and
greater structure/aggregate volume fractions typically correlating to higher indices. Together, these measurements demonstrated that our cells’ refractive indices could be engineered through
the introduction of arrangements of reflectin-based structures, i.e. photonic architectures, within their interiors. In turn, we investigated the influence of the squid protein-based
structures on the local propagation of light through our engineered human cells. Towards this end, we specifically probed RfA1-expressing HEK 293 cells containing multiple large, readily
distinguished structures (or possibly nanoparticle clusters) with TLC-QPM in real time. This technique measures how incident light changes its phase when transmitted by different objects,
such as living cells positioned on a substrate, and therefore enables generation of both phase images and corresponding optical pathlength maps (see the Methods for details)39,40,41.
Initially, the TLC-QPM images obtained for RfA1-expressing cells revealed numerous higher-phase structures (dark black spots, white arrows), which were distributed throughout the cells’
interiors and possessed apparent diameters on the order of ~0.8 to ~2 μm (Fig. 3c, top left). The corresponding optical pathlength maps indicated that the longer pathlengths (with respect to
the immediate surroundings) were exactly correlated to the structures’ subcellular locations (dark red spots, white arrows), suggesting that their presence had substantially modified the
local refractive index (Fig. 3c, top right). Subsequently, the TLC-QPM images obtained for the same RfA1-expressing cells after a period of 30 min revealed that they still contained numerous
higher-phase structures (dark black spots, white arrows), which had maintained their apparent sizes but changed their positions (Fig. 3c, bottom left). The corresponding optical pathlength
maps indicated that the longer pathlengths (again with respect to the immediate surroundings) had analogously shifted but were still correlated to the structures’ subcellular locations (dark
red spots, white arrows), suggesting a concomitant spatial redistribution of the modifications in the local refractive index (Fig. 3c, bottom right). Interestingly, the time-lapse videos
generated from multiple phase images and optical pathlength maps, which were collected for the cells at different time intervals, demonstrated that the RfA1-based structures dynamically
moved within the cytoplasm and occasionally congregated near the membranes, positioning themselves for release into the surroundings within extracellular vesicles (Supplementary Movies 1 and
2). The findings were in general agreement with our analyses of the TEM images obtained for the RfA1-expressing cells, which captured snapshots of the expulsion of the larger structures by
the cells (Fig. 2b and Supplementary Fig. 10). These experiments demonstrated that the specific position or arrangement of the reflectin-based structures within our cells’ interiors
determined the way in which they locally transmitted light. Subsequently, we quantified and analyzed the optical characteristics of the individual squid protein-based structures within our
engineered human cells. Specifically, we calculated the refractive indices of the readily distinguished structures, which appeared somewhat larger than those most frequently observed with
TEM, positioned near the perimeters of the RfA1-expressing cells. For the purpose of these calculations, we assumed that the structures’ diameters, as roughly estimated from the TLC-QPM
images, were similar to the cells’ heights at their peripheries, and used the equation \({\mathrm{OPL}} = \frac{{\lambda \Delta \phi }}{{4\pi }} = {\it{d}}\left( {{\it{n}}_{\mathrm{a}} -
{\it{n}}_{\mathrm{s}}} \right)\), where OPL is the optical pathlength, _λ_ is the central wavelength of the imaging light, Δ_ϕ_ is the phase difference, _d_ is the apparent diameter of the
structure, _n_a is the refractive index of the structure, and _n_s is the refractive index of the immediate surroundings39,40. The calculations performed for an ensemble of representative
RfA1-based structures yielded size-dependent refractive indices that varied from ~1.48 to ~1.62, with the higher and lower values generally corresponding to the smaller and larger apparent
diameters, respectively (Fig. 3d). These values were comparable to the refractive indices of ~1.44 reported for reflectin-filled condensed lamella in iridophores27, ~1.51 measured for
reflectin-containing leucosomes in leucophores19, and ~1.54 to ~1.59 found for substrate-bound reflectin films24,32. In contrast, the analogous calculations performed for representative
regions of the cytoplasm proximal to the large structures yielded size-independent refractive indices that varied from ~1.36 to ~1.39 (Fig. 3d). These values were comparable to the
refractive indices of ~1.35 to ~1.37 previously reported for the cytoplasm of mammalian cells44,45,46. Interestingly, the refractive index distribution for the larger RfA1-based
nanostructures found at the perimeters of our engineered human cells (Fig. 3d) roughly resembled the refractive index distribution for the larger reflectin-containing leucosomes found inside
cuttlefish leucophores (Supplementary Fig. 18)19. In their totality, our observations intimated that it might, in principle, be possible to more precisely engineer our cells’ optical
characteristics by expressing reflectins conjugated with known targeting peptides and inducing such proteins to form well-defined distributions of high refractive index aggregates in
specific subcellular locations. TUNABLE OPTICAL PROPERTIES FOR THE ENGINEERED CELLS Last, we sought to assess whether the light-transmitting properties of our engineered human cell cultures
could be controllably modulated, i.e. tuned, with an external chemical stimulus. To accomplish this goal, we designed and prepared sandwich-type configurations, wherein the bottom layer was
a fibronectin-coated glass slide, the middle layer was fixed RfA1-expressing HEK 293 cells exposed to media with different ionic strengths (i.e. distinct NaCl concentrations), and the top
layer was a glass coverslip overlaid onto the cells (see Fig. 4a and the Methods for details). We then visualized the cell cultures with brightfield microscopy, a technique which measures
how incident light is attenuated upon transmission through different objects and furnishes corresponding brightness/intensity images that are readily analyzed via digital image processing
methods47,48. Specifically, for RfA1-expressing cell cultures exposed to media with a standard (i.e. 117 mM) NaCl concentration, the representative brightfield microscopy images obtained
revealed that the cells did not substantially attenuate the incident light and appeared similar to the environment (Fig. 4a, bottom). For RfA1-expressing cell cultures exposed to media with
a higher (i.e. 217 mM) NaCl concentration, the analogous representative images revealed that the cells now more strongly attenuated the incident light and appeared relatively distinct from
the environment (Fig. 4a, bottom). Additionally, for RfA1-expressing cells exposed to the standard NaCl concentration media, the brightfield microscopy images’ representative histograms of
the number of pixels at different intensity values spanned a relatively narrow range of ~175 to ~215 with a maximum at ~195, thus quantitatively confirming the cells’ similarity to the
surroundings (Supplementary Fig. 19a). For RfA1-expressing cells exposed to the higher NaCl concentration media, the analogous representative histograms spanned a wider range of ~130 to ~220
with a shifted maximum at ~187, thus quantitatively confirming the cells’ increased contrast with the surroundings (Supplementary Fig. 19b). By comparison, the representative brightfield
microscopy images obtained for untransfected cell cultures revealed that they attenuated less incident light than the RfA1-expressing cells and did not substantially change appearance after
exposure to the higher NaCl concentration media (Supplementary Fig. 20). The images’ representative histograms for the untransfected cells were comparable to those of the cells’ surroundings
and also remained relatively unchanged after exposure to the higher NaCl concentration media (Supplementary Fig. 21). Notably, the fluorescence microscopy images of live RfA1-expressing and
untransfected cells stained with the calcein AM and ethidium homodimer-1 dyes showed that their viabilities and densities were unaffected by the media’s NaCl concentration (Supplementary
Fig. 22). The fluorescence microscopy images of fixed RfA1-expressing and untransfected cells stained with fluorophore-tagged wheat germ agglutinin likewise showed that their areas were
unaffected by the media’s NaCl concentration (Supplementary Fig. 23). Together, these experiments suggested, yet again, that our engineered cells’ internalized, high refractive index,
reflectin-based photonic architectures determined the way in which they transmitted light and also showed that exposure of such cells to variable ionic strength media did not influence their
viabilities or morphologies but did alter (tune) their light-transmitting properties (i.e. transparency with respect to the surroundings). Next, we investigated precisely why the engineered
human cell cultures’ transmission and reflection of light were affected by the application of a chemical stimulus. For this purpose, we again prepared sandwich-type configurations from
RfA1-expressing cells that had been exposed to media with different ionic strengths (i.e. distinct NaCl concentrations) and then systematically characterized these configurations with a
combination of transmittance and reflectance spectroscopy (see the Methods for details). First, the representative total transmittance and total reflectance spectra recorded for the
RfA1-expressing cell cultures indicated that their broadband transmittance decreased and that their broadband reflectance increased after exposure to the higher NaCl concentration media
(Supplementary Fig. 24). In comparison, the representative total transmittance and total reflectance spectra recorded for the untransfected cell cultures indicated that their broadband
transmittances and reflectances were larger and smaller, respectively, than those of the RfA1-expressing cell cultures and were relatively unchanged by exposure to the higher NaCl
concentration media (Supplementary Fig. 25). In addition, the diffuse transmittance and diffuse reflectance spectra recorded for the RfA1-expressing cell cultures revealed that the diffuse
components of the transmittance increased from ~5.5 (±1.5)% to ~13 (±2.1)% (i.e. by >~2-fold) and that the diffuse components of the reflectance increased from ~1.1 (±0.1)% to ~2.1
(±0.2)% (i.e. by ~2-fold) after exposure to the higher NaCl concentration media (Fig. 4b and Supplementary Fig. 26). In comparison, the diffuse transmittance and diffuse reflectance spectra
recorded for the untransfected cell cultures revealed that the diffuse reflectance and transmittance components were both lower than those of the RfA1-expressing cell cultures and also were
relatively unchanged by exposure to the higher NaCl concentration media (Supplementary Figs. 26 and 27). Furthermore, the transmittance and reflectance spectra obtained for fibronectin
matrices in the same configuration but without any cells revealed relatively high total transmittances and low total reflectances with minor background diffuse components (Supplementary
Figs. 25 and 27). Interestingly, the NaCl concentration-induced tuning of the transparency and broadband diffuse reflectance for our sandwich-type configurations from RfA1-expressing cells
(Fig. 4a, b) bore a superficial resemblance to the acetylcholine-triggered switching of the opacity and broadband reflectance for female _D. opalescens_ squids’ leucophore-containing layers
(Supplementary Fig. 1). Overall, the spectroscopic measurements demonstrated that the introduction of internalized, high refractive index, reflectin-based photonic architectures caused our
cells to diffusely transmit and/or diffusely reflect (i.e. scatter) more of the incident visible light and that exposure of these engineered cells to variable ionic strength media further
enhanced (tuned) their scattering of visible light, thus providing an explanation for their ability to change transparency with respect to the surroundings. To better understand the
mechanistic underpinnings of our engineered human cells’ tunable scattering of incident light, we employed aqueous reflectin solutions as in vitro model systems and investigated how the
solutions’ appearances, transmittances, and reflectances were influenced by our chosen chemical stimulus. For this purpose, we first solubilized histidine-tagged RfA1 that had been
heterologously expressed in _E. coli_ and then systematically increased the ionic strength (i.e. NaCl concentration) of the resulting aqueous solutions, while characterizing them with a
synergistic combination of digital camera imaging, transmittance and reflectance spectroscopy, and dynamic light scattering (DLS) (see the Methods for details). First, the representative
digital camera images, total transmittance spectra, and total reflectance spectra obtained for RfA1 solutions with a standard (i.e. 117 mM) NaCl concentration revealed that they were visibly
transparent to the naked eye, transmitted most of the incident light, and reflected little of the incident light, respectively (Fig. 4c and Supplementary Fig. 28). In contrast, the
representative digital camera images, total transmittance spectra, and total reflectance spectra obtained for RfA1 solutions with a high (i.e. 217 mM) NaCl concentration revealed that they
were visibly opaque to the naked eye, transmitted much less of the incident light, and reflected slightly more of the incident light, respectively (Fig. 4c and Supplementary Fig. 28). In
addition, the DLS measurements, diffuse transmittance spectra, and diffuse reflectance spectra obtained for the solutions with the standard NaCl concentration revealed that they primarily
contained RfA1 nanoparticles with diameters of ~36 (±10) nm and featured relatively low diffuse transmittance and diffuse reflectance components with average values of ~3.3 (±1.0)% and ~0.8
(±0.2)%, respectively, indicating that such solutions very weakly scattered visible light (Fig. 4d and Supplementary Figs. 29 and 30). In comparison, the DLS measurements, diffuse
transmittance spectra, and diffuse reflectance spectra obtained for the solutions with the higher NaCl concentration revealed that they primarily contained RfA1 nanoparticles with diameters
of ~106 (±9) nm and featured much larger diffuse transmittance and diffuse reflectance components with average values of ~15.1 (±4.4)% and ~1.9 (±0.3)%, respectively, indicating that such
solutions more strongly scattered visible light presumably via a Mie-type mechanism (Fig. 4d and Supplementary Figs. 29 and 30)49. In general, for our RfA1 solutions, the diameters of their
constituent nanoparticle populations and the values of their diffuse transmittance and diffuse reflectance components increased as a function of the NaCl concentration, underscoring the fact
that the sizes and/or aggregation states of the RfA1-based nanoparticles determined the solutions’ associated degree of light scattering and thus overall transparencies (Supplementary Figs.
29 and 30)49. Moreover, the analogous aqueous solutions without RfA1 nanoparticles featured relatively low background diffuse transmittances and diffuse reflectances and were completely
transparent to the naked eye, further supporting our analysis (Supplementary Fig. 30). The in vitro measurements suggested that external ionic strength changes could reconfigure the sizes,
geometries, and/or arrangements of our engineered cells’ internalized, high refractive index, reflectin-based photonic architectures and consequently could modulate the cells’ diffuse
transmission and/or reflection, i.e. scattering, of incident visible light. As such, when considered within the context of the in vivo observations presented above and the previous findings
for light scattering by leucosome arrangements in leucophores17,18,19,20, our experiments together provided a plausible explanation for the origins of our engineered cellular systems’
tunable optical properties. DISCUSSION In summary, by drawing inspiration from the subcellular structures and adaptive optical functionalities of cephalopod leucophores, we have
conceptualized and realized human cells that encompass reconfigurable protein-based photonic architectures and thus possess tunable light-transmitting and light-reflecting capabilities. We
believe that our findings hold broad scientific and technological significance for multiple reasons. First, our work introduces the concept of directly engineering the optical properties,
i.e. refractive index, and extent of light scattering, for living human cells via the incorporation of reflectin-based structures and, therefore, lays the groundwork for the development of
mammalian cells and organoids with other sophisticated cephalopod-inspired optical functionalities, such as stimuli-responsive dynamic iridescence or mechanically reconfigurable
coloration26,50. Second, the unexpected observation that reflectin-based structure arrangements not only readily self-assemble but also maintain their high refractive indices within the
foreign biological environment of human cells suggests that common paradigms, e.g. sequence motifs, may underpin the structures and functions of reflectin-based architectures within the
proteins’ diverse native biological environments, which include chromatophore sheath cells50, iridophores25,26,27,28, and leucophores17,18,19,20. Third, given that such native cephalopod
skin cells remain quite challenging to culture, the reported designer mammalian cells may constitute appropriate surrogate model frameworks for making further discoveries with regard to the
properties of reflectins and the molecular and cellular biology of molluscs. Fourth, reflectins’ unique orthogonal amino acid sequences and validated high refractive indices in vivo could
make them ideal biomolecular reporters for the quantitative phase microscopy visualization of varied cellular processes, e.g. expulsion of extracellular vesicles, across typically
non-transparent biological specimens41, in approaches reminiscent of the ones pioneered for jellyfish green fluorescent proteins with fluorescence microscopy51,52. Fifth, reflectins’ diverse
stimuli-responsive self-assembly properties and ease of expression reported herein may enable real-time adaptive refractive index matching of specific mammalian cells to their surroundings
and, thus, facilitate imaging of entire living tissues with improved clarity and resolution on conventional optical microscopes, as done in studies of static deceased tissues with seminal
clearing techniques10,11. In general, the continued development and exploration of engineered reflectin-producing systems via the aforementioned strategies could help answer fundamental
questions associated with three-dimensional inter- and intra-cellular organization relevant for light-cell and light-tissue interactions in both cephalopods and other animals. Consequently,
our findings may afford a variety of exciting opportunities and possibilities within the fields of biology, materials science, and bioengineering. METHODS GROWTH AND TRANSFECTION OF HUMAN
CELLS The human embryonic kidney (HEK) 293 cells (ATCC, CRL-1573TM) were grown and transfected according to standard protocols. First, vector constructs encoding for the independent
expression of N-terminal histidine-tagged _D. (Loligo) pealeii_ reflectin A1 (RfA1) (Genbank: ACZ57764.1), the independent expression of Cayenne Red Fluorescent Protein (RFP), or the
expression of both RfA1 and RFP (with the expression of the latter mediated by an internal ribosome entry site from the encephalomyocarditis virus) were designed by ATUM using their Gene
Designer Software. The vectors all contained 5′UTR regions downstream of a cytomegalovirus promoter and enhancer, a standard origin of replication derived from pBR322, a polyadenylation
signal to aid in the termination of transcription, and cDNA encoding for the protein or proteins of interest. Subsequently, HEK 293 cells (ATCC, CRL-1573TM) were cultured on plastic or
fibronectin-coated glass dishes in Minimal Essential Medium (MEM) supplemented with Earle’s salts and 10% fetal bovine serum (FBS) (Life Technologies) at a temperature of 37 °C and under 5%
CO2. For transfection, the HEK 293 cells were seeded at ~5% to ~33% of the confluent density for the plastic or glass dishes and grown for another ~14 to ~24 h. The medium was swapped for
MEM supplemented with Earle’s salts but lacking FBS. A transfection reagent mixture containing Lipofectamine 2000 (Life Technologies) and a vector encoding for just RfA1, just RFP, or both
RFA1 and RFP (ATUM) was added to the medium, and the cells were incubated for ~24 to ~48 h. Typically, the untransfected or transfected cell cultures were grown to confluencies of ~50% to
~75%. The cells were fixed as necessary, used for the preparation of cellular cross-sections, or directly characterized with microscopy techniques. EXPRESSION AND PURIFICATION OF REFLECTIN
A1 IN BACTERIA N-terminal histidine-tagged RfA1 was expressed and purified according to procedures modified from the literature32. In brief, an _E. coli_ codon optimized gene coding for the
histidine-tagged RfA1 protein from _D. (Loligo) pealeii_ (Genbank: ACZ57764.1) was synthesized and cloned into the pJExpress414 vector (ATUM). This expression vector was transformed into
BL21 (DE3) cells (Novagen). The protein was expressed in Lysogeny Broth (LB) (Novagen) supplemented with 100 μg/mL Carbenicillin at a temperature of 37 °C. RfA1 was completely insoluble when
expressed at 37 °C and was sequestered in inclusion bodies. The cells were lysed using BugBuster (Novagen) according to the manufacturer’s protocols, and the inclusion bodies were extracted
by filtration and centrifugation. The inclusion bodies were then solubilized in denaturing buffer (6 M guanidine hydrochloride), and the protein was purified via high performance liquid
chromatography (HPLC) on an Agilent 1260 Infinity system using a reverse phase C18 column. For purification, the gradient was evolved from 95% Buffer A:5% Buffer B to 5% Buffer A:95% Buffer
B at a flow rate of 4 mL/min over 35 min (Buffer A: 99.9% water, 0.1% trifluoroacetic acid; Buffer B: 95% acetonitrile, 4.9% water, 0.1% trifluoroacetic acid). The pure RfA1 was collected,
flash frozen in liquid nitrogen, and lyophilized. The identity of the protein was confirmed with sodium dodecyl sulfate polyacrylamide gel electrophoresis (SDS-PAGE), tryptic digestion, and
mass spectrometry, prior to use in any characterization experiments. PREPARATION OF HUMAN CELLS FOR IMMUNOFLUORESCENCE MICROSCOPY The untransfected or transfected HEK 293 cells were fixed
and labeled with fluorescent markers according to standard protocols. First, the cells were seeded on 8-well or 12-well glass-bottom micro-slides (Ibidi) coated with human fibronectin
(Corning) at a density of ~30,000 cells/cm2 and were grown for ~14 to ~16 h. When necessary, the HEK 293 cells were either (1) transfected with vectors encoding for just RfA1, just RFP, or
both RfA1 and RFP for ~48 h (see Growth and transfection of human cells); (2) mock transfected, i.e. subjected to the transfection reagents in the absence of any vector, under the same
conditions; or (3) exposed to the FBS-free growth media in the absence of any transfection reagents or vectors under the same conditions. The untransfected or transfected cells were fixed
with 3% paraformaldehyde (PFA) in 0.1 M phosphate buffer (PB), permeabilized with 0.1% Triton-X 100 in phosphate buffered saline (PBS) containing 1% bovine serum albumin (BSA), and blocked
with 1% BSA in PBS. The fixed untransfected or transfected cells were incubated with either an oligoclonal rabbit anti-histidine-tag primary antibody (ThermoScientific, 710286) solution
(prepared at a ratio of 1:500 in PBS containing 1% BSA) or a polyclonal rabbit anti-reflectin primary antibody solution (prepared at a ratio of 1:1000 in PBS containing 1% BSA)21. The cells
were thoroughly washed with PBS and incubated with a goat anti-rabbit IgG Alexa 488 secondary antibody (ThermoScientific, 11008) solution (prepared at a ratio of 1:250 in PBS containing 1%
BSA) and with the nuclear stain 4′,6′-diamidino-2-phenylindole (DAPI) (ThermoScientific). After labeling, the cells were again washed with PBS, and treated with anti-fade mounting media
(Ibidi). The resulting stained fixed untransfected and transfected cells were imaged with confocal fluorescence microscopy. PREPARATION OF HUMAN CELLS FOR LIVE/DEAD ASSAYS The untransfected
or transfected HEK 293 cells were labeled with the Calcein AM dye (live cell stain) and the Ethidium Homodimer-1 dye (dead cell stain) according to standard protocols. First, the cells were
seeded on 3-well removable chamber glass slides (Ibidi) coated with human fibronectin (Corning) at a density of ~60,000 cells/cm2 and were grown for ~14 to ~16 h. When necessary, the HEK 293
cells were transfected with vectors encoding for RfA1 over a period of ~48 h (see Growth and transfection of human cells) or were exposed to the FBS-free growth media in the absence of any
transfection reagents or vectors under the same conditions. Next, the untransfected or transfected cells were incubated for ~1 h in MEM supplemented with Earle’s salts, for which the NaCl
concentration was adjusted to 117 or 217 mM. In turn, the cells were washed with D-PBS (ThermoScientific) and stained with Calcein AM (ThermoScientific) and Ethidium Homodimer-1
(ThermoScientific) solutions. The resulting stained untransfected and transfected cells were imaged with fluorescence microscopy. PREPARATION OF HUMAN CELLS FOR CELL AREA ASSAYS The
untransfected or transfected HEK 293 cells were labeled with fluorescently-tagged wheat germ agglutinin according to standard protocols. First, the cells were seeded on 3-well removable
chamber glass slides (Ibidi) coated with human fibronectin (Corning) at a density of ~60,000 cells/cm2 and were grown for ~14 to ~16 h. When necessary, the HEK 293 cells were transfected
with vectors encoding for RfA1 for ~48 h (see Growth and transfection of human cells) or were exposed to the FBS-free growth media in the absence of any transfection reagents or vectors
under the same conditions. Next, the untransfected or transfected cells were incubated for ~1 h in MEM supplemented with Earle’s salts, for which the NaCl concentration was adjusted to 117
mM or 217 mM. In turn, the cells were stained with Alexa 555 fluorophore-conjugated wheat germ agglutinin (ThermoScientific) in Hank’s Balanced Salt Solution (HBSS) (ThermoScientific) and
subsequently washed in pre-warmed HBSS. Finally, the cells were fixed with 3% PFA in 0.1 M PB. The resulting stained untransfected and transfected cells were imaged with fluorescence
microscopy. BRIGHTFIELD OPTICAL MICROSCOPY AND SPECTROSCOPY The untransfected or transfected HEK 293 cell cultures were integrated into sandwich-type configurations. First, 3-well removable
chamber glass slides (Ibidi) were coated with human fibronectin (Corning). Next, HEK 293 cells were seeded at densities of ~60,000 cells/cm2 and were grown for ~14 to ~16 h. When necessary,
the cells were transfected with vectors encoding for RfA1 for ~48 h (see Growth and transfection of human cells) or were exposed to the FBS-free growth media in the absence of any
transfection reagents or vectors under the same conditions. Next, the untransfected or transfected cells were incubated for ~1 h in MEM supplemented with Earle’s salts, for which the NaCl
concentration was adjusted to 117 or 217 mM. In turn, the substrates with monolayers at a ~50% to ~75% confluency were fixed with 3% PFA in PBS, thoroughly washed with PBS, treated with
anti-fade mounting media (Ibidi), and covered (overlaid) with a thin glass coverslip. Note that the preparation and use of cell cultures within the ~50% to ~75% confluency window ensured
rigorous quality control and facilitated comparisons across all of the experiments. The resulting configurations, which contained either fixed transfected or untransfected cells, were imaged
with brightfield optical microscopy and characterized with reflectance and transmittance spectroscopy. PREPARATION OF CELLS FOR TRANSMISSION ELECTRON MICROSCOPY The untransfected or
transfected HEK 293 were segmented into cross-sections according to literature protocols53. First, HEK 293 cells were seeded at densities of ~32,000 cells/cm2 into T-25 flasks
(ThermoScientific) and were grown for ~18 to ~24 h. Typically, the HEK 293 cells were transfected with vectors encoding for just RfA1, just RFP, or both RfA1 and RFP for ~48 h in house (see
Growth and transfection of human cells) or were exposed to the FBS-free growth media in the absence of any transfection reagents or vectors under the same conditions. Alternatively, for
independent confirmation of our experiments, the HEK 293 cells were cultured in Improved MEM supplemented with 10% FBS and were transfected with a reagent mixture containing Fugene HD and
the vector encoding for RfA1 at ATUM. Next, the cells were fixed with 2.5% glutaraldehyde in 0.1 M sodium cacodylate buffer (Electron Microscopy Sciences) and spun down into a cell pellet.
Subsequently, the pellet was blocked with 1% osmium tetroxide in 0.15 M sodium cacodylate buffer (LADD Research), stained with 2% uranyl acetate in double distilled water (LADD Research),
and dehydrated with ethanol (LADD Research). The cells were then embedded in Durcupan resin (Sigma) and sectioned on an Ultracut UC6 Ultramicrotome (Leica) by using a diamond knife
(Diatome). The sections were next transferred onto copper mesh grids (LADD Research) and post-stained with uranyl acetate and lead citrate (Electron Microscopy Sciences). The final fixed,
resin-embedded, grid-mounted cross-sections were imaged with transmission electron microscopy. PREPARATION OF HUMAN CELLS FOR IMMUNO-ELECTRON MICROSCOPY The transfected HEK 293 cells were
segmented and labeled with gold nanoparticles according to literature protocols54,55. First, HEK 293 cells were seeded at densities of ~32,000 cells/cm2 into T-25 flasks (ThermoScientific)
and were grown for ~18 to ~24 h. The HEK 293 cells were then transfected with vectors encoding for both RfA1 and RFP (see Growth and transfection of human cells) for ~48 h. Next, the cells
were fixed overnight with 4% PFA in 0.1 M PB (Electron Microscopy Sciences), rinsed with 0.15% glycine in 0.1 M PB, pelleted in 10% gelatin in 0.1 M PB, and cryoprotected by infusion with
2.3 M sucrose in 0.1 M PB. Cell blocks with volumes of 1 mm3 were then mounted onto cryopins, and flash frozen in liquid nitrogen. The frozen blocks were cut into ~70 to ~90 nm ultra-thin
cross-sections at a temperature of –100 °C on an Ultracut UC6 Ultramicrotome with a cryo-attachment (Leica) by using a diamond cryo-knife (Diatome). The sections were in turn picked up with
a 1:1 mixture of 2.3 M sucrose in 0.1 M PB and 2% methyl cellulose (Aldrich) in water and transferred onto Formvar and carbon-coated copper grids (Electron Microscopy Sciences). The
grid-mounted sections were then placed on 2% gelatin in PBS, rinsed with 0.15% glycine in PBS, and blocked with 1% fish-skin gelatin (Sigma) in PBS. The grid-mounted sections were incubated
with a polyclonal rabbit anti-reflectin primary antibody followed by a goat anti-rabbit secondary IgG antibody conjugated to a 12 nm gold nanoparticle (Jackson Immuno Research). The
resulting grid-mounted sections were post-fixed with 1% glutaraldehyde in PBS, washed thoroughly with distilled water, and subsequently post-stained with 0.2% uranyl acetate (LADD Research)
in 1.8% methyl cellulose in water. The final fixed, resin-embedded, cryoprotected, and labeled cross-sections were imaged with transmission electron microscopy. PREPARATION OF HUMAN CELLS
FOR QUANTITATIVE PHASE MICROSCOPY The untransfected and transfected HEK 293 cells were grown as described above, with minor modifications to the protocol. In brief, the cells were seeded at
a density of ~5000 cells/cm2 on glass substrates and grown for ~14 to ~16 h. When necessary, the cells were transfected with vectors encoding for just RfA1 or for both RfA1 and RFP (see
Growth and transfection of human cells) immediately prior to imaging. For reflection-mode experiments, the cells were cultured on custom-designed 35 mm glass-bottom dishes featuring an
anti-reflection coating39, which were coated with human fibronectin (Corning). For transmission-mode experiments, the cells were cultured on custom-designed 35 mm glass-bottom dishes
featuring a half-mirror coating, which were coated with human fibronectin39. The untransfected or transfected cells were characterized with low-coherence quantitative phase microscopy with
or without a fluorescence microscopy attachment. PREPARATION OF AQUEOUS REFLECTIN A1 SOLUTIONS The solutions were prepared according to procedures adopted from the literature29,32. In brief,
purified, lyophilized protein was first solubilized in deionized water at a concentration of ~1 to ~4 mg/mL and a low pH of <~5. The protein solution was then diluted to a concentration
of ~0.5 mg/mL, and the NaCl concentration was adjusted to 117, 167, 217, or 334 mM as appropriate. The resulting solutions were characterized with transmittance and reflectance spectroscopy
and dynamic light scattering. PHASE CONTRAST AND FLUORESCENCE MICROSCOPY OF HUMAN CELLS The live untransfected or transfected HEK 293 cells were characterized with an Olympus IX51 equipped
with an Olympus TH4100 light source, an Olympus U-RFL-T fluorescence laser source, and a QICAM camera. The resulting phase contrast and fluorescence images were analyzed with ImageJ (v
2.0.0-rc-69/1.52i). CONFOCAL MICROSCOPY OF IMMUNOLABELED HUMAN CELLS The fixed and immunolabeled untransfected or transfected HEK 293 cells were characterized with an LSM 780 confocal
microscope equipped with a Nikon GaAsP detector and an Argon laser (with fluorophore excitation wavelengths of 405, 458, and 514 nm). The resulting confocal and fluorescence microscopy
images were captured with ZEN software and analyzed with ImageJ (v 2.0.0-rc-69/1.52i). FLUORESCENCE MICROSCOPY OF STAINED HUMAN CELLS The untransfected or transfected HEK 293 cells stained
with the Calcein AM and Ethidium Homodimer-1 dyes were characterized with an EVOS M5000 Imaging System (ThermoScientific) in fluorescence imaging mode. The fixed untransfected or transfected
HEK 293 cells labeled with wheat germ agglutinin conjugated to an Alexa Fluor 555 dye were characterized with an EVOS M5000 Imaging System (ThermoScientific) in fluorescence imaging mode.
The resulting images were analyzed with ImageJ (v 2.0.0-rc-69/1.52i). TRANSMISSION ELECTRON MICROSCOPY OF CELLULAR CROSS-SECTIONS The fixed, resin-embedded, cross-sections from untransfected
or transfected HEK 293 cells were characterized with a Tecnai G2 Spirit BioTWIN transmission electron microscope equipped with an Eagle 4k HS digital camera (FEI). The resulting
transmission electron microscopy images were analyzed with ImageJ (v 2.0.0-rc-69/1.52i). IMMUNO-ELECTRON MICROSCOPY OF LABELED CELLULAR CROSS-SECTIONS The fixed, resin-embedded,
cryoprotected, and labeled cross-sections from transfected HEK 293 cells were characterized with a JEOL 1400Plus transmission electron microscope (JEOL) and outfitted with a OneView 16
megapixel digital camera (Gatan). QUANTITATIVE PHASE MICROSCOPY OF LIVE HUMAN CELLS The live transfected HEK 293 cells were characterized with a custom-built low-coherence quantitative phase
microscope (Hamamatsu). For reflection-mode experiments, the instrument was outfitted with a heating element, a piezo-driven adjustable sample stage (NanoControl), a fluorescence detection
module featuring an excitation filter with a center wavelength of 525 nm (Edmund Optics), a high performance long-pass emission filter with a cut-on wavelength of 575 nm (Edmund Optics), and
a light-emitting diode with a broadband emission wavelength from 575 to 700 nm. The resulting interference images were analyzed and converted to optical pathlength maps, geometric height
maps, and refractive index maps with MATLAB 2017a (MathWorks, Inc.) as previously described39. For transmission-mode experiments, the instrument was outfitted with a heating element, an
adjustable sample stage (OptoSigma), and a narrowband light-emitting diode with an emission wavelength of 633 nm. The resulting interferences images were analyzed with MATLAB 2017a
(MathWorks, Inc.) and converted to phase images and optical pathlength maps as previously described39. The phase images and optical pathlength maps were further analyzed with ImageJ to
extract the apparent diameter and refractive index of the RfA1-based structures or cytoplasmic regions (note that the accuracy of the size estimates was limited by the use of the 633 nm
laser and the resolution of the images and maps). BRIGHTFIELD OPTICAL MICROSCOPY OF HUMAN CELLS The sandwich-type configurations from untransfected or transfected HEK 293 cells were
characterized with an EVOS M5000 Imaging System (ThermoScientific) in brightfield imaging mode. The resulting brightfield optical images were analyzed with ImageJ (v 2.0.0-rc-69/1.52i). The
histograms of the number of pixels at different intensity values were extracted from the images and analyzed by using the Histogram function in ImageJ according to standard image processing
and analysis procedures reported in the literature47,48,56. The histograms were plotted with Igor Pro 6.1. SPECTROSCOPY OF HUMAN CELLS AND REFLECTIN A1 SOLUTIONS The sandwich-type
configurations containing untransfected or transfected HEK 293 cells, and the RfA1 solutions in quartz cuvettes (Millipore Sigma) were characterized with a V-670 UV-VIS-NIR Spectrophotometer
(Jasco) outfitted with a 150 mm Integrating Sphere (Jasco). The obtained spectra were plotted with Igor Pro 6.1 DYNAMIC LIGHT SCATTERING OF REFLECTIN A1 SOLUTIONS The RfA1 solutions were
characterized with a Zeta-Sizer Nano S (Malvern). The obtained correlograms were analyzed and converted to particle size distributions with the Malvern Panalytical software and plotted with
Igor Pro 6.1. STATISTICAL ANALYSIS The statistical analyses were performed using Prism v.8 software (GraphPad). Data sets from two samples were compared by applying a Student’s _t_-test to
calculate two-tailed _p_-values. OVERVIEW OF STATISTICS AND REPRODUCIBILITY Representative immunofluorescence images from _n_ = 5 biological replicates are shown in Fig. 2a. Representative
transmission electron microscopy images from _n_ = 4 biological replicates are shown in Fig. 2b. Representative immunofluorescence images from _n_ = 5 biological replicates are shown in Fig.
2c. Representative immuno-electron microscopy images from _n_ = 3 technical replicates are shown in Fig. 2d. Representative phase images from _n_ = 6 biological replicates are shown in Fig.
3a. Representative phase images, fluorescence images, and refractive index maps from _n_ = 5 biological replicates are shown in Fig. 3b. Representative phase images and optical pathlength
maps from _n_ = 4 biological replicates are shown in Fig. 3c. Representative brightfield microscopy images from _n_ = 5 biological replicates are shown in Fig. 4a. Representative diffuse
transmittance spectra and diffuse reflectance spectra from at least _n_ = 5 biological replicates are shown Fig. 4b. Representative digital camera images from _n_ = 6 biological replicates
are shown in Fig. 4c. Representative diffuse transmittance spectra and diffuse reflectance spectra from at least _n_ = 5 biological replicates are shown Fig. 4d. REPORTING SUMMARY Further
information on research design is available in the Nature Research Reporting Summary linked to this article. DATA AVAILABILITY All data needed to evaluate the conclusions in the paper are
present in the paper and/or the supplementary information. Source data are available in the Source Data file. All other relevant data are available from the authors upon reasonable request.
REFERENCES * Plato & Jowett, B. (Transl) _The Republic_ (Dover Publications, Inc, Mineola, 2000). * Wells, H. G. _The Invisible Man_ (Penguin Group, New York, 2005). Google Scholar *
Siddique, R. H., Gomard, G., & Hölscher, H. The role of random nanostructures for the omnidirectional anti-reflection properties of the glasswing butterfly. _Nat. Commun._
https://doi.org/10.1038/ncomms7909 (2015). * Bhandiwad, A. & Johnsen, S. The effects of salinity and temperature on the transparency of the grass shrimp Palaemonetes pugio. _J. Exp.
Biol._ 214, 709–716 (2011). Article PubMed Google Scholar * Welch, V., Vigneron, J. P., Lousse, V., & Parker, A. Optical properties of the iridescent organ of the comb-jellyfish
_Beroë cucumis_ (Ctenophora). _Phys. Rev. E_ https://doi.org/10.1103/PhysRevE.73.041916 (2006). * Guayasamin, J. M. et al. A marvelous new glassfrog (Centrolenidae, Hyalinobatrachium) from
Amazonian Ecuador. _Zookeys_ 673, 1–20 (2017). Article Google Scholar * Zylinski, S. & Johnsen, S. Mesopelagic cephalopods switch between transparency and pigmentation to optimize
camouflage in the deep. _Curr. Biol._ 21, 1937–1941 (2011). Article CAS PubMed Google Scholar * Johnsen, S. Hidden in plain sight: the ecology and physiology of organismal transparency.
_Biol. Bull._ 201, 301–318 (2001). Article CAS PubMed Google Scholar * Johnsen, S. Hide and seek in the open sea: pelagic camouflage and visual countermeasures. _Ann. Rev. Mar. Sci._ 6,
369–392 (2014). Article PubMed Google Scholar * Richardson, D. S. & Lichtman, J. W. Clarifying tissue clearing. _Cell_ 162, 246–257 (2015). Article CAS PubMed PubMed Central
Google Scholar * Susaki, E. A. & Ueda, H. R. Whole-body and whole-organ clearing and imaging techniques with single-cell resolution: toward organism-level systems biology in mammals.
_Cell Chem. Biol._ 23, 137–157 (2016). Article CAS PubMed Google Scholar * Phan, L. et al. Dynamic materials inspired by cephalopods. _Chem. Mater._ 28, 6804–6816 (2016). Article CAS
Google Scholar * Chatterjee, A., Norton-Baker, B., Bagge, L. E., Patel, P., & Gorodetsky, A. A. An introduction to color-changing systems from the cephalopod protein reflectin.
_Bioinspir. Biomim._ https://doi.org/10.1088/1748-3190/aab804 (2018). * Mäthger, L. M., Denton, E. J., Marshall, N. J. & Hanlon, R. T. Mechanisms and behavioural functions of structural
coloration in cephalopods. _J. R. Soc. Interface_ 6, S149–S163 (2008). PubMed PubMed Central Google Scholar * Hanlon, R. T. & Messenger, J. B. _Cephalopod Behaviour_ (Cambridge
University Press, New York, 2018). Book Google Scholar * Cloney, R. A. & Brocco, S. L. Chromatophore organs, reflector cells, iridocytes and leucophores in cephalopods. _Am. Zool._ 23,
581–592 (1983). Article Google Scholar * DeMartini, D. G. et al. Dynamic biophotonics: female squid exhibit sexually dimorphic tunable leucophores and iridocytes. _J. Exp. Biol._ 216,
3733–3741 (2013). Article CAS PubMed Google Scholar * Froesch, D. & Messenger, J. B. On leucophores and the chromatic unit of _Octopus vulgaris_. _J. Zool. Lond._ 186, 163–173
(1978). Article Google Scholar * Mäthger, L. M. et al. Bright white scattering from protein spheres in color changing, flexible cuttlefish skin. _Adv. Funct. Mater._ 23, 3980–3989 (2013).
Article CAS Google Scholar * Hanlon, R. T., Mäthger, L. M., Bell, G. R. R., Kuzirian, A. M., & Senft, S. L. White reflection from cuttlefish skin leucophores. _Bioinspir. Biomim._
https://doi.org/10.1088/1748-3190/aaa3a9 (2018). * Crookes, W. J. et al. Reflectins: the unusual proteins of squid reflective tissues. _Science_ 303, 235–238 (2004). Article ADS CAS
PubMed Google Scholar * Levenson, R., DeMartini, D. G., & Morse, D. E. Molecular mechanism of reflectin’s tunable biophotonic control: opportunities and limitations for new
optoelectronics. _APL Mater._ https://doi.org/10.1063/1.4985758 (2017). * Zhao, H., Brown, P. H. & Schuck, P. On the distribution of protein refractive index increments. _Biophys. J._
100, 2309–2317 (2011). Article ADS CAS PubMed PubMed Central Google Scholar * Kramer, R. M., Crookes-Goodson, W. J. & Naik, R. R. The self-organizing properties of squid reflectin
protein. _Nat. Mater._ 6, 533–538 (2007). Article ADS CAS PubMed Google Scholar * DeMartini, D. G., Izumi, M., Weaver, A. T., Pandolfi, E. & Morse, D. E. Structures, organization,
and function of reflectin proteins in dynamically tunable reflective cells. _J. Biol. Chem._ 290, 15238–15249 (2015). Article CAS PubMed PubMed Central Google Scholar * DeMartini, D.
G., Krogstad, D. V. & Morse, D. E. Membrane invaginations facilitate reversible water flux driving tunable iridescence in a dynamic biophotonic system. _Proc. Natl Acad. Sci. USA_ 110,
2552–2556 (2013). Article ADS CAS PubMed Google Scholar * Ghoshal, A., DeMartini, D. G., Eck, E., & Morse, D. E. Experimental determination of refractive index of condensed
reflectin in squid iridocytes. _J. R. Soc. Interface_ https://doi.org/10.1098/rsif.2014.0106 (2014). * Tao, A. R. et al. The role of protein assembly in dynamically tunable bio-optical
tissues. _Biomaterials_ 31, 793–801 (2010). Article CAS PubMed Google Scholar * Levenson, R., Braken, C., Bush, N. & Morse, D. E. Cyclable condensation and hierarchical assembly of
metastable reflectin proteins, the drivers of tunable biophotonics. _J. Biol. Chem._ 291, 4058–4068 (2016). Article CAS PubMed Google Scholar * Naughton., K. L. et al. Self-assembly of
the cephalopod protein reflectin. _Adv. Mater._ 28, 8405–8412 (2016). Article CAS PubMed Google Scholar * Guan, Z. et al. Origin of the reflectin gene and hierarchical assembly of its
protein. _Curr. Biol._ 27, 2833–2842 (2017). Article CAS PubMed Google Scholar * Phan, L. et al. Reconfigurable infrared camouflage coatings from a cephalopod protein. _Adv. Mater._ 25,
5621–5625 (2013). Article CAS PubMed Google Scholar * Phan, L. et al. Infrared invisibility stickers inspired by cephalopods. _J. Mater. Chem. C_ 3, 6493–6498 (2015). Article CAS
Google Scholar * Ordinario, D. D. et al. Protochromic devices from a cephalopod structural protein. _Adv. Optical Mater._ https://doi.org/10.1002/adom.201600751 (2017). * Thomas, P. &
Smart, T. G. HEK293 cell line: a vehicle for the expression of recombinant proteins. _J. Pharmacol. Toxicol. Methods_ 51, 187–200 (2005). Article CAS PubMed Google Scholar * Rajan, R.
S., Illing, M. E., Bence, N. F. & Kopito, R. R. Specificity in intracellular protein aggregation and inclusion body formation. _Proc. Natl Acad. Sci. USA_ 98, 13060–13065 (2001). Article
ADS CAS PubMed Google Scholar * Schuster, B. S. et al. Controllable protein phase separation and modular recruitment to form responsive membraneless organelles. _Nat. Commun._
https://doi.org/10.1038/s41467-018-05403-1 (2018). * Müller-Taubenberger, A. & Anderson, K. I. Recent advances using green and red fluorescent protein variants. _Appl. Microbiol.
Biotechnol._ https://doi.org/10.1007/s00253-007-1131-5 (2007). * Yamauchi, T., Iwai, H., Miwa, M. & Yamashita, Y. Low-coherent quantitative phase microscope for nanometer-scale
measurement of living cells morphology. _Opt. Express_ 16, 12227–12238 (2008). Article ADS PubMed Google Scholar * Yamauchi, T. et al. Transportable and vibration-free full-field
low-coherent quantitative phase microscope. _SPIE BiOS_ https://doi.org/10.1117/12.2289473 (2018). * Park, Y. K., Depeursinge, C. & Popescu, G. Quantitative phase imaging in biomedicine.
_Nat. Photonics_ 12, 578–589 (2018). Article ADS CAS Google Scholar * Rappaz, B. et al. Measurement of the integral refractive index and dynamic cell morphometry of living cells with
digital holographic microscopy. _Opt. Express_ 13, 9361–9373 (2005). Article ADS PubMed Google Scholar * Lue, N. et al. Live cell refractometry using microfluidic devices. _Opt. Lett._
31, 2759–2761 (2006). Article ADS PubMed Google Scholar * Choi, W. et al. Tomographic phase microscopy. _Nat. Methods_ 4, 717–719 (2007). Article CAS PubMed Google Scholar * Liu, P.
Y. et al. Cell refractive index for cell biology and disease diagnosis: past, present and future. _Lab Chip_ 16, 634–644 (2016). Article CAS PubMed Google Scholar * Curl, C. L. et al.
Refractive index measurement in viable cells using quantitative phase-amplitude microscopy and confocal microscopy. _Cytom. A_ 65, 88–92 (2005). Article Google Scholar * Pietka, E.
_Handbook of Medical Image Processing and Analysis_ Vol. 2 (ed. Bankman, I. N.). Ch. 51 (Academic Press, 2009). * Tan, L. & Jiang, J. _Digital Signal Processing_ 3rd edn (Academic Press,
2013). * Bohren, C. F. & Huffman, D. R. _Absorption and Scattering of Light by Small Particles_ (Wiley-VCH, Weinheim, Germany, 1998). Book Google Scholar * Williams, T. L. et al.
Dynamic pigmentary and structural coloration within cephalopod chromatophore organs. _Nat. Commun._ 10, 1004 (2019). * Tsien, R. Y. The green fluorescent protein. _Annu. Rev. Biochem._ 67,
509–544 (1998). Article CAS PubMed Google Scholar * Chudakov, D. M., Matz, M. V., Lukyanov, S. & Lukyanov, K. A. Fluorescent proteins and their applications in imaging living cells
and tissues. _Physiol. Rev._ 90, 1103–1163 (2010). Article CAS PubMed Google Scholar * Spur, A. R. A low-viscosity epoxy resin embedding medium for electron microscopy. _J. Ultrastruct.
Res._ 26, 31–43 (1969). Article Google Scholar * Liou, W., Geuze, H. J. & Slot, J. W. Improving structural integrity of cryosections for immunogold labeling. _Histochem. Cell Biol._
106, 41–58 (1996). Article CAS PubMed Google Scholar * Tokuyasu, K. T. Immunochemistry on ultrathin frozen sections. _Histochem. J._ 12, 381–403 (1980). Article CAS PubMed Google
Scholar * Weber, A., Cheney, M., Smithwick, Q. & Elsner, A. Polarimetric imaging and blood vessel quantification. _Opt. Express_ 12, 5178–5190 (2004). Article ADS PubMed Google
Scholar Download references ACKNOWLEDGEMENTS We acknowledge Prof. M. McFall-Ngai and Prof. N. Ruby for the donation of the reflectin antibodies. We thank Prof. S. Wang’s laboratory for the
use of their phase contrast and fluorescence microscopes. We thank Dr. Laura Bagge, as well as Timothy Meerloo and Ying Jones at the University of California, San Diego Electron Microscopy
Core, for their assistance with the sample preparation and the transmission electron microscopy experiments. We thank Rylan Kautz and Mahan Naeim for insightful discussions with regard to
cell culture protocols, and Andrew Reuter and Ethan Peng for assistance with evaluation of the quantitative phase microscopy data. We are grateful to the Defense Advanced Research Projects
Agency (Cooperative Agreement W911NF-17-2-0142 to A.A.G.) and the Air Force Office of Scientific Research (Grants FA9550-17-1-0024 and FA9550-16-1-0296 to A.A.G.) for their financial
support. The production of the reflectin antibodies was supported by the National Institutes of Health (Grants R37 AI50661 to M.M.-N. and R01 OD11024 to E.G.R.). This study was made possible
in part through access to resources at the Laser Spectroscopy Labs; the Optical Biology Core Facility of the Developmental Biology Center at the University of California, Irvine, which is
supported by the Cancer Center Support Grant (CA-62203) and the Center for Complex Biological Systems Support Grant (GM-076516); the Laboratory for Fluorescence Dynamics (LFD) at the
University of California, Irvine, which is supported jointly by the National institute of General Medical Sciences of the National institutes of Health (2P41GM103540) and the University of
California, Irvine; the Electron Microscopy Core at the University of California, San Diego, in which some of the equipment is supported by the National institutes of Health (1S10OD023527);
and the Laser Microbeam and Medical Program, which is an NIH/NIBIB Biotechnology Resource Center (LAMMP: P41EB015890-33). AUTHOR INFORMATION AUTHORS AND AFFILIATIONS * Department of Chemical
and Biomolecular Engineering, University of California, Irvine, Irvine, CA, 92697, USA Atrouli Chatterjee & Alon A. Gorodetsky * Department of Molecular Biology and Biochemistry,
University of California, Irvine, Irvine, CA, 92697, USA Juana Alejandra Cerna Sanchez * Beckman Laser Institute and Medical Clinic, University of California, Irvine, Irvine, CA, 92697, USA
Toyohiko Yamauchi * Central Research Laboratory, Hamamatsu Photonics, Hamamatsu, Shizuoka, 4348601, Japan Toyohiko Yamauchi * Electron Microscopy Core, University of California, San Diego,
La Jolla, CA, 92093, USA Vanessa Taupin * Department of Materials Science and Engineering, University of California, Irvine, Irvine, CA, 92697, USA Justin Couvrette & Alon A. Gorodetsky
* Department of Chemistry, University of California, Irvine, Irvine, CA, 92697, USA Alon A. Gorodetsky Authors * Atrouli Chatterjee View author publications You can also search for this
author inPubMed Google Scholar * Juana Alejandra Cerna Sanchez View author publications You can also search for this author inPubMed Google Scholar * Toyohiko Yamauchi View author
publications You can also search for this author inPubMed Google Scholar * Vanessa Taupin View author publications You can also search for this author inPubMed Google Scholar * Justin
Couvrette View author publications You can also search for this author inPubMed Google Scholar * Alon A. Gorodetsky View author publications You can also search for this author inPubMed
Google Scholar CONTRIBUTIONS A.A.G. conceived the project. A.C. and A.A.G. designed and interpreted the experiments. A.C. performed the cell culture growth and transfection experiments;
phase contrast microscopy, fluorescence microscopy, and brightfield microscopy characterization; reflectance and transmittance spectroscopy measurements; and the associated data analysis and
modeling. J.A.C.S. performed the immunostaining and associated immunofluorescence microscopy experiments. J.A.C.S. and V.T. performed the transmission electron microscopy imaging. J.C.
assisted with the analysis of the transmission electron microscopy images. V.T. performed the immuno-electron microscopy imaging. A.C. and T.Y. performed and analyzed the quantitative phase
microscopy measurements. A.C., J.A.C.S., and A.A.G wrote the manuscript. CORRESPONDING AUTHOR Correspondence to Alon A. Gorodetsky. ETHICS DECLARATIONS COMPETING INTERESTS The authors
declare no competing interests. ADDITIONAL INFORMATION PEER REVIEW INFORMATION _Nature Communications_ thanks Tara Deans and the other, anonymous, reviewer(s) for their contribution to the
peer review of this work. PUBLISHER’S NOTE Springer Nature remains neutral with regard to jurisdictional claims in published maps and institutional affiliations. SUPPLEMENTARY INFORMATION
SUPPLEMENTARY INFORMATION SUPPLEMENTARY MOVIE 1 SUPPLEMENTARY MOVIE 2 DESCRIPTION OF ADDITIONAL SUPPLEMENTARY FILES REPORTING SUMMARY SOURCE DATA SOURCE DATA RIGHTS AND PERMISSIONS OPEN
ACCESS This article is licensed under a Creative Commons Attribution 4.0 International License, which permits use, sharing, adaptation, distribution and reproduction in any medium or format,
as long as you give appropriate credit to the original author(s) and the source, provide a link to the Creative Commons license, and indicate if changes were made. The images or other third
party material in this article are included in the article’s Creative Commons license, unless indicated otherwise in a credit line to the material. If material is not included in the
article’s Creative Commons license and your intended use is not permitted by statutory regulation or exceeds the permitted use, you will need to obtain permission directly from the copyright
holder. To view a copy of this license, visit http://creativecommons.org/licenses/by/4.0/. Reprints and permissions ABOUT THIS ARTICLE CITE THIS ARTICLE Chatterjee, A., Cerna Sanchez, J.A.,
Yamauchi, T. _et al._ Cephalopod-inspired optical engineering of human cells. _Nat Commun_ 11, 2708 (2020). https://doi.org/10.1038/s41467-020-16151-6 Download citation * Received: 23
September 2019 * Accepted: 10 April 2020 * Published: 02 June 2020 * DOI: https://doi.org/10.1038/s41467-020-16151-6 SHARE THIS ARTICLE Anyone you share the following link with will be able
to read this content: Get shareable link Sorry, a shareable link is not currently available for this article. Copy to clipboard Provided by the Springer Nature SharedIt content-sharing
initiative
Trending News
Mumbai indians eye revenge against kxip - hw news englishMUMBAI | Revenge will be on their mind when Mumbai Indians lock horns with Kings XI Punjab, the hosts looking to stretch...
#biryanigate: what is the truth about jnu students cooking ‘beef biryani’ in campus? - scoopwhoopJawaharlal Nehru University has slapped fines on four students for – believe it or not – cooking and eating biryani near...
What matters most — freightonomicsWHEN TIMES GET TOUGH, HERE’S WHAT’S REALLY IMPORTANT Anthony Smith and Zach Strickland made their predictions for the st...
Uk foreign office issues turkey warning to tourists over 'highly risky' moveANYONE PLANNING TO GO TO TURKEY FOR A HOLIDAY THIS YEAR IS BEING URGED TO BEAR IN MIND THE LATEST TRAVEL ADVICE 09:39, 2...
Casey affleck slips into darkness in ain't them bodies saintsAfter watching _Ain’t Them Bodies Saints_, it’s hard not to conclude once and for all that the wrong Affleck brother is ...
Latests News
Cephalopod-inspired optical engineering of human cellsABSTRACT Although many animals have evolved intrinsic transparency for the purpose of concealment, the development of dy...
Rapid estimation of the specific surface of a powderABSTRACT THE rapid estimation of the specific surface of a powder falling in the sub-sieve size-range is a matter of con...
Technics and Civilization | NatureABSTRACT THIS book provides an interesting and thought-provoking contribution to the history of the machine and its soci...
Antitumor efficacy of aav-mediated systemic delivery of interferon-βABSTRACT Type I interferons (_α_/_β_) have significant antitumor activity although their short half-life and systemic si...
British fungi and how to identify them_British Fungi and How to Identify Them._ By J. H. Crabtree. Pp. 62. (London: C. H. Kelly, n.d.) Price 1_s_. net. Access...