The genome-wide multi-layered architecture of chromosome pairing in early drosophila embryos
The genome-wide multi-layered architecture of chromosome pairing in early drosophila embryos"
- Select a language for the TTS:
- UK English Female
- UK English Male
- US English Female
- US English Male
- Australian Female
- Australian Male
- Language selected: (auto detect) - EN
Play all audios:
ABSTRACT Genome organization involves _cis_ and _trans_ chromosomal interactions, both implicated in gene regulation, development, and disease. Here, we focus on _trans_ interactions in
_Drosophila_, where homologous chromosomes are paired in somatic cells from embryogenesis through adulthood. We first address long-standing questions regarding the structure of embryonic
homolog pairing and, to this end, develop a haplotype-resolved Hi-C approach to minimize homolog misassignment and thus robustly distinguish _trans_-homolog from _cis_ contacts. This
computational approach, which we call Ohm, reveals pairing to be surprisingly structured genome-wide, with _trans_-homolog domains, compartments, and interaction peaks, many coinciding with
analogous _cis_ features. We also find a significant genome-wide correlation between pairing, transcription during zygotic genome activation, and binding of the pioneer factor Zelda. Our
findings reveal a complex, highly structured organization underlying homolog pairing, first discovered a century ago in _Drosophila_. Finally, we demonstrate the versatility of our
haplotype-resolved approach by applying it to mammalian embryos. SIMILAR CONTENT BEING VIEWED BY OTHERS STAGE-RESOLVED HI-C ANALYSES REVEAL MEIOTIC CHROMOSOME ORGANIZATIONAL FEATURES
INFLUENCING HOMOLOG ALIGNMENT Article Open access 08 October 2021 THE IMPACT OF CHROMOSOMAL FUSIONS ON 3D GENOME FOLDING AND RECOMBINATION IN THE GERM LINE Article Open access 20 May 2021
ORDER AND STOCHASTICITY IN THE FOLDING OF INDIVIDUAL _DROSOPHILA_ GENOMES Article Open access 04 January 2021 INTRODUCTION Although chromosomes are organized within the nucleus into distinct
territories, they nevertheless come into contact _in trans_. In diploid organisms, including mammals, such _trans_ contacts may involve specific interactions, such as pairing, between the
homologous maternal and paternal chromosomes. Although best known in meiotic cells, homolog pairing can also occur in somatic cells and influence gene expression via phenomena such as
transvection (reviewed by1,2,3). In _Drosophila_, somatic pairing increases extensively from early embryogenesis to adulthood, making this organism an ideal system for studying _trans_
interactions (reviewed by1,2,3). What, for example, is the structure of homolog pairing in early embryos? Pairing may encompass many forms, ranging from a well-aligned juxtaposition of
homologs (railroad track), to a loose, laissez-faire association of homologous regions, or even an apposition of highly disordered structures; for instance, pairing in mammalian systems can
manifest as a nonrandom, approximate co-localization of homologous chromosomal regions (reviewed by1,2). Recently, high- and super-resolution4,5,6,7 imaging of several genomic loci has
suggested that pairing can involve distinct chromosomal domains as well as more closely merged regions, while simulations of pairing8 via integration of the lamina-DamID data and the Hi-C
data have predicted correlations between pairing and epigenetic domains. Furthermore, a transgene-based study of transvection has proposed a domain-based mode for pairing9. These studies are
consistent with long-standing discussions about the establishment, maintenance, and stability of pairing as well as the relationship between pairing and transcription (reviewed
by1,2,3,10,11). Nevertheless, questions regarding the extent and structure of pairing remain. More recently, Hi-C-derived ligation products with overlapping sequences have been used to infer
short-range interactions between homologs or sister chromatids in a tetraploid Kc167 cell line and thus a correlation between short-range interactions and active regions12. Here, we asked
how pairing initiates in early _Drosophila_ embryos, when maternal and paternal genomes first meet. Although the imaging of individual loci has documented the initiation of pairing during
early embryogenesis13,14,15,16,17, the global structure of pairing and its genome-wide relationship to fundamental developmental programs has remained elusive. To that end, we took advantage
of single nucleotide variants (SNVs) to enable haplotype-resolved Hi-C. Haplotype-resolved Hi-C has previously been used to study _cis_ interactions in mammalian
systems18,19,20,21,22,23,24,25,26,27,28,29 as well as _trans_-homolog interactions in yeast30 and, here, we developed a method (Ohm) to much more confidently identify those _trans_
interactions that occur between homologous chromosomes. Importantly, our approach allowed us to detect both short- and long-range interactions, that is, interactions spanning genomic
distances as small as a few kilobases to several megabases. Excitingly, haplotype-resolved Hi-C as well as Ohm can be applied to any organism whose genome sequence has been
haplotype-resolved, and we demonstrate their generality by applying them also to studies25,26 of early mammalian embryos. Strikingly, our Ohm approach reveals that homolog pairing is
extensive along entire lengths of chromosomes at short- as well as long-range distances and is highly structured, with _trans_-homolog domains, domain boundaries, compartments, and
interaction peaks. We reveal the coincidence between _trans_-homolog features and the positions and sizes of analogous _cis_ features and then provide a three-axis framework of precision,
proximity, and continuity to accommodate all types of inter-chromosomal interactions, including homolog pairing. These findings complement those of our companion study (AlHaj Abed, Erceg,
Goloborodko et al.31), which, by generating and then using a _Drosophila_ hybrid cell line with a high degree of pairing, enabled a much more in-depth analysis of the structure of pairing.
In particular, this other study observed at least two forms of pairing and correlations between these forms and the active or repressed state of chromatin. In our current study, we also
explore the relationship between pairing and the developmental programs in play in the early embryo during the initial stages of pairing. We find that pairing correlates with the opening of
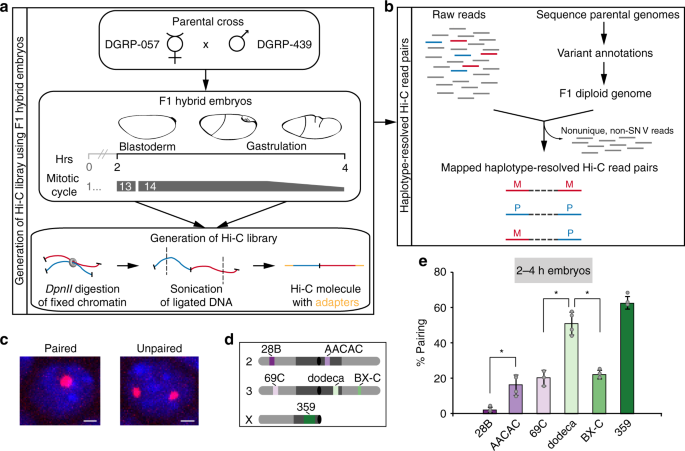
chromatin mediated by the pioneer factor Zelda during zygotic genome activation. RESULTS HAPLOTYPE-RESOLVED HI-C FOR PROFILING EMBRYONIC PAIRING We focused our Hi-C analysis on the window of
_Drosophila_ embryogenesis extending from 2–4 h after egg laying (AEL), when zygotic gene transcription is activated and the embryo transitions from a syncytial blastoderm into a
multicellular state32. It is during this window that maternal and paternal homologs come together for the first time13,14,15, and the rapid early cleavage cycles give way to the longer 13th
and 14th cycles, thus minimizing the contribution of mitotic genome organization to our Hi-C signal33. To generate the embryos for our study, we mated two divergent _Drosophila_ Genetic
Reference Panel lines, 057 and 439 (Fig. 1a, b), as a high density of SNVs is required for assaying homolog pairing via genomic methods. Indeed, strains 057 and 439 differ with an average
SNV frequency of ~5.5 per kilobase (kb), except on chromosome 4 (1.0 SNV/kb) (see Supplementary Note 1). This frequency was adjusted to ~5.1 SNVs/kb (0.01 for chr4) when we re-sequenced both
lines and reconstructed an F1 diploid genome using only high-confidence homozygous SNVs (Supplementary Fig. 1 and Supplementary Table 1, see Methods); this diploid genome assembly ensured
the most stringent haplotype-resolved mapping of Hi-C products. Importantly, we confirmed that hybrid embryos achieved levels of homolog pairing consistent with those observed in other
studies13,14,15,16,17 using fluorescent in situ hybridization (FISH) to assess pairing (Fig. 1c) at heterochromatic (16.0% ± 5.7–62.4% ± 3.6) and euchromatic (2.0% ± 1.5–22.0% ± 2.4) loci
across different chromosomes (Fig. 1d, e). In addition, pairing increased to expected levels in 057/439 embryos as they aged (Supplementary Fig. 2a). We performed Hi-C and recovered 513
million Hi-C products, which after mapping to the reference genome, yielded ~56% unique read pairs (Supplementary Table 2). When assembled into a map and analyzed at 1 kb resolution without
regard to parental origin of the mapped fragments, these reads revealed features that are routinely seen in non-haplotype-resolved Hi-C maps33,34—a central _cis_ diagonal representing
short-distance interactions in _cis_ (_cis_ read pairs) as well as signatures for compartments, domains (also called contact domains19 and topologically associated domains, or TADs35,36,
hereafter referred to as domains), and interaction peaks—thus confirming the quality of our Hi-C data (Supplementary Fig. 2b). Presence of these interphase hallmarks indicates that the vast
majority of the cells are in interphase rather than mitosis, where such features are absent33. OHM-DIRECTED DISTINCTION OF _TRANS_-HOMOLOG FROM _CIS_ CONTACTS Using our newly generated
haplotype-resolved F1 diploid genome to determine the parental origin of our reads, we found that 5.8% of all mappable read pairs appeared to represent _trans_ (_trans_-homolog as well as
_trans_-heterolog) contacts and that, of these, 36.1% indicated contacts between homologous chromosomes (_trans_-homolog read pairs) (Supplementary Table 3). Encouraged by these numbers, we
next determined the quality of the purported _trans_-homolog reads. For example, errors in reconstruction of the F1 diploid genome or sequencing of the Hi-C products can lead to
misassignment of _cis_ read pairs as _trans_-homolog read pairs (Fig. 2a) and, given the greater number of _cis_ as versus _trans_-homolog read pairs, even a small rate of misassignment of
_cis_ read pairs could be confounding. Thus, to assess the potential magnitude of homolog misassignment, we sought a signature for it in our Hi-C dataset, focusing on read pairs where the
separation along the genome (genomic separation) of the two reads of a read pair is <1 kb (Fig. 2b, shaded area). We chose to examine these read pairs because they are enriched in
non-informative byproducts of the Hi-C protocol37, the most abundant being unligated pieces of DNA, known as dangling ends (Fig. 2b, hatched area and Supplementary Fig. 3, see Methods).
Dangling ends have genomic separations of <1 kb, are “inwardly” orientated, and 100–1,000 fold more abundant than read pairs of other orientations at the same separations (Supplementary
Fig. 4a) and, since they are exclusively _cis_ read pairs, their enrichment among _trans_-homolog read pairs can only arise via homolog misassignment (HM in figures and Methods). As such,
the enrichment of short-distance (<1 kb) _trans_-homolog pairs can serve as a signature of homolog misassignment and be used to assess the overall quality of our homolog assignment
(Methods). Consistent with this hypothesis, this signature of homolog misassignment almost disappeared when we increased the stringency of our mapping by requiring at least two SNVs per read
(Fig. 2c and Supplementary Fig. 4b, c, probability of homolog misassignment PHM = 0.01%). In contrast, homolog misassignment increased when we used the less accurate DGRP SNV annotations
(Supplementary Fig. 4d, PHM = 2.40%). This approach, which we call Oversight of homolog misassignment (Ohm), allowed us to estimate the probability of homolog misassignment as only ~0.17%
when requiring at least 1 SNV per read (Fig. 2d, see Methods). Finally, this analysis indicated that homolog misassignment introduced less than 5% of erroneous _trans_-homolog contacts at
separations above 1 kb (Fig. 2e). Having gained confidence that contamination contributes only a minor portion of purported _trans_-homolog read pairs, we observed that _trans_-homolog
contacts at genomic separations of 1 kb are >100-fold more frequent than those at genomic separations of >1 Mb, and >500 fold more frequent than contacts between regions on
different chromosomes (_trans_-heterolog, Fig. 2b). Thus, _trans_-homolog contacts constitute a major fraction of _trans_-chromosomal interactions. HOMOLOG PAIRING IN _DROSOPHILA_ EMBRYOS IS
HIGHLY STRUCTURED We next generated a Hi-C map using ≥ 1 SNV per read and filtering our data to exclude contacts below 3 kb of genomic separation in order to substantially reduce
contamination by Hi-C byproducts. The resulting map was striking in a number of ways (Supplementary Fig. 2b). In addition to displaying the expected central _cis_ diagonal, it revealed
prominent _“trans_-homolog_”_ diagonals that extended across the entire length of each chromosome (Fig. 3a, black arrows). This observation demonstrated that interactions between homologs,
including those within a few kilobases and up to several megabases, extend genome-wide in early embryos at the time when pairing is being initiated. The _trans_-homolog diagonals suggest
that homologs are relatively well-aligned when coming into contact, consistent with a railroad track structure (Fig. 3b). This indication, however, does not preclude less aligned forms of
pairing, such as the paired domains observed at a number of genomic regions4,5,6,7. For example, Fig. 2b also shows that extensive _trans_-homolog interactions may occur between non-allelic
regions corresponding to genomic separations of hundreds of kilobases or more, albeit at much reduced frequencies. We would expect such interactions to appear as signals at varying distances
off the _trans_-homolog diagonals, leaving open the possibility of other structures, such as laissez-faire (Fig. 3c) and highly disordered pairing (Fig. 3d). That pairing may assume
different forms in _Drosophila_ has long been considered (reviewed by1,2,3), with recent studies suggesting that the state of pairing is a fine balance between pairing and anti-pairing
factors (reviewed by2). Here, we propose a framework in which the different aspects of pairing can be placed along the continuum of three axes representing (i) the precision with which
homologous regions are aligned (_x_ axis), (ii) the proximity with which homologs are held together (_y_ axis), and (iii) the continuity or degree to which a particular state of pairing
extends uninterrupted (_z_ axis), with the continuum along any axis potentially reflecting different forms of pairing and/or the maturation (or degradation) of pairing over time (Fig. 3e).
In this context, high values along all three axes would produce railroad track pairing, intermediate values would approximate a laissez-faire mode of pairing, and minimum values would
encompass interactions ranging from extreme laissez-faire to disorder. This framework can also be used to describe _trans_ interactions between heterologous chromosomes, particularly
prominent examples being those arising from the Rabl polarization of centromeres and telomeres, appearing in some Hi-C maps, including ours, as contacts along non-homologous arms (e.g. 2L
and 2R, as well as 3L and 3R)33,34; the Rabl configuration may facilitate homolog pairing by reducing search space within the nucleus (Fig. 3f13,14,15). Note, however, that _trans_-homolog
contacts were tighter and/or more frequent than _trans_-heterolog contacts (Fig. 3g, h), emphasizing the prevalence of homolog pairing in _Drosophila_. We next asked whether our
haplotype-resolved maps could further clarify the molecular structure of paired homologs as well as elucidate how _trans_-homolog interactions are integrated with the _cis_ interactions that
shape the 3D organization of the genome. Remarkably, we observed _trans_-homolog domains, domain boundaries, compartments, and interaction peaks resembling analogous features in _cis_ maps
(Fig. 3i–k and Supplementary Fig. 5a–e). In fact, 54% of the boundaries of _trans_-homolog domains overlapped a boundary of a _cis_ domain (averaged over two homologs, Supplementary Fig.
5f). While this value is lower than the upper bound of 72% for _trans_-homolog boundaries shared between replicate haplotype-resolved Hi-C datasets, it is nevertheless significantly above
the 35% overlap expected at random (_P_ < 10−10, _t_-test). Note that, as we obtained 92.3% overlap of domain boundaries between replicates of non-haplotype-resolved Hi-C datasets, it is
likely that the overlap values for haplotype-resolved datasets reflect the relatively low number of haplotype-resolved reads we obtained. The similarity between _trans_-homolog and _cis_
contact maps is further highlighted through comparisons with maternal- and paternal-specific Hi-C domains, which have been observed in other systems to be concordant21; in our dataset, we
observed 73.9% concordance between _cis_ domain boundaries of homologous chromosomes (Supplementary Fig. 5f; also Fig. 3l and Supplementary Fig. 5g, h), wherein concordance between two
replicates was 73.2% (see Methods). _Trans-_homolog maps do, however, differ from some _cis_-defined features (Fig. 3m and Supplementary Fig. 5i, dark blue; see also31). Taken together, our
findings indicate that homolog pairing goes far beyond simple genome-wide alignments of homologous pairs and includes surprisingly structured _trans_-homolog domains, boundaries, and
specific interaction peaks that frequently correspond to _cis_ features (Fig. 3n). HOMOLOG PAIRING IS ASSOCIATED WITH ZYGOTIC GENOME ACTIVATION Spurred on by the rich history of transvection
(reviewed by1,2,3) we asked how broadly pairing might be correlated genome-wide with fundamental developmental events such as the binding of major transcription factors in the early
_Drosophila_ embryo. We focused our attention on arguably the four most prominently studied maternally-contributed factors, involved in zygotic genome activation, in particular key
developmental events such as the opening of chromatin, initiation of transcription, and embryonic pattern formation: the pioneer factor Zelda (Zld), which mediates early chromatin
accessibility38,39; Bicoid (Bcd)40 and Dorsal (Dl)41, which are involved in patterning the anterior-posterior (AP) and dorsal-ventral (DV) axis, respectively; and GAGA factor (GAF)42, which
may facilitate transcription in later stages. We correlated the binding of these factors, as revealed by ChIP-seq datasets40,41,43, to local variations in the degree of pairing as
characterized by the pairing score (PS), defined as the log2 _trans_-homolog contact frequency within a 28 kb window along the diagonal of Hi-C maps (Methods). Excitingly, regions associated
with elevated PS values were significantly enriched for the binding of Zld and Bcd (_P_ < 10−10, Spearman; Fig. 4a) as compared to controls in which we randomized 200 kb chunks of PS
values (Fig. 4b) or 200 kb chunks of binding profiles (Supplementary Fig. 6a). No correlation was observed, however, between PS values and the binding of GAF or Dl (_P_ = 0.139, _P_ = 0.029,
Spearman, respectively; Fig. 4b). Then, using partial correlation analyses, we examined whether these correlations would be affected upon removal of the contribution of a third feature. For
instance, how might the correlation between the binding of Bcd and PS values be affected by the binding of Zld? We found that Zld binding contributes significantly, as Spearman’s
correlation coefficient dropped from 0.155 (_P_ = 2.1 × 10−65; Fig. 4b) to 0.044 (_P_ = 1.3 × 10⁻⁶; Supplementary Fig. 6b), when controlled for Zld binding. Interestingly, Spearman’s
correlation coefficient between the binding of Dl and PS values decreased from −0.020 (_P_ = 0.029; Fig. 4b) to −0.157 (_P_ = 3.0 × 10−67; Supplementary Fig. 6b) when controlled for the
contribution of Zld. These findings are consistent with a role of Zld in Bcd- as well as Dl-dependent binding and gene activation40,41. Interestingly, we observed that genes associated with
both AP and DV patterning44,45 are similarly associated with higher PS values (Supplementary Fig. 6c). Moreover, loss of Bcd binding in Zld-depleted embryos40 was significantly enriched at
regions otherwise associated with high PS values (_P_ < 1.21 × 10−68, Mood’s median test; Supplementary Fig. 6d, e). In sum, our data suggest that Zld-mediated early opening of chromatin,
including the binding of Bcd, is strongly correlated with pairing in embryos. As previous studies suggested that regions with high Zld occupancy were more dependent on Zld for establishing
domain boundaries33, we asked whether Zld may play a role in domains that are established via _trans_-homolog interactions. Several observations supported our hypothesis. First, visual
inspection of our Hi-C revealed that _trans_-homolog domain boundaries are associated with high Zld occupancy and, moreover, are associated with values of PS that are higher than those of
the interior of domains (Fig. 4a and Supplementary Fig. 7a, _P_ < 10−10, Mood’s median test). Interestingly, 25% of the top Zld-occupied regions have high PS values (_P_ < 10−10,
Mood’s median test, Fig. 4c). Second, using Hi-C data from Zld-depleted embryos33, we observed a decrease of boundary strength at regions that would otherwise be associated with high PS
values and strong Zld binding (Fig. 4d and Supplementary Fig. 7b, _P_ < 10−10, Spearman). Third, we found that Zld depletion trended strongly toward reduced pairing, with the reduction
being significant at four out of six loci assayed (_P_ < 2.56 × 10⁻³, Fisher’s two-tailed exact; Supplementary Fig. 7c, d). Finally, we also observed strong correlations between PS values
and features known to be enriched at domain boundaries, such as RNA Pol II33, housekeeping genes33,46, and nascent zygotic gene products47 (Supplementary Fig. 6c, 7e). Thus, Zld-mediated
chromatin accessibility and transcription appear correlated with the establishment of homolog pairing in the early embryo (Fig. 4e), reinforcing the notion that the establishment of homolog
pairing may bear a relationship to genome function during key developmental events. For example, Zld-mediated opening of genomic regions may facilitate homologous sequences finding each
other when pairing is initiated in early embryogenesis. Whether Zelda plays a direct or indirect role in initiating pairing, however, will require additional study, as will the interplay
between Zld and other factors involved in pairing and other forms of chromosome organization. HAPLOTYPE-RESOLVED APPLICATION OF OHM TO MAMMALIAN EMBRYOS One of the most exciting developments
in recent years has been the growing indication that homolog pairing is not special to _Drosophila_, that it may be a general property in many organisms, including mammals (reviewed by1,2).
Thus, in order to both demonstrate the applicability of Ohm as well as assess the state of pairing in mammals, we applied our haplotype-resolved Ohm approach to mammalian embryos. As
pairing in mammals is generally transient and localized, for example, during DNA repair, V(D)J recombination, imprinting, or X-inactivation (reviewed by1,2), these analyses would, at the
least, also serve as a control for observations in _Drosophila_, where pairing is far more extensive. In particular, we considered two deeply sequenced Hi-C datasets from Du et al.25 and Ke
et al.26 representing gametes and F1 hybrid mouse embryos bearing a high frequency of SNVs (1 autosomal SNV per ~130 bp or ~490 bp, respectively). Reasoning that the haploid nature of sperm
and oocytes precludes homolog pairing, we focused first on these cell types to determine the level of stringency that would be necessary to remove any apparent _trans_-homolog read pairs
that would necessarily have resulted from homolog misassignment (Supplementary Fig. 8a). That level of stringency was ≥2 SNVs per read (Supplementary Fig. 8b and Supplementary Data 1, see
Methods). Requiring ≥2 SNVs per read, we turned to the datasets representing embryos ranging in age from the single, 2-, 4-, and 8-cell stage through the earliest days of embryogenesis and
beyond. We observed no conclusive signal for _trans_-homolog contacts (Supplementary Figs. 9 and 10), consistent especially for the very earliest stages with previous indications that the
maternal and paternal genomes are spatially segregated25,26,48,49,50; (Supplementary Fig. 9). More specifically, although the signal for _trans-_homolog contacts for some of the earlier
stages seemed to hover above that expected from homolog misassignment (Supplementary Fig. 9) and thus raise the possibility of homolog pairing, this discordance between observed and expected
_trans_-homolog contacts could also reflect artifacts arising from a non-uniform genomic density of SNVs and/or Hi-C biases (see37); we were unable to resolve this issue due to the sparsity
of data (Supplementary Data 1). The data also raise the possibility of a higher order clustering of homologous as well as heterologous subtelomeric regions (Supplementary Fig. 10),
reminiscent of the clustering of pericentromeric and subtelomeric regions seen previously48. While, again, the sparsity of data precluded our ability to determine such clustering reflected
any degree of homolog pairing, it is worth noting that telomere as well as centromere clustering has been reported in embryos across several species34,48,51 and may constitute a mechanism
for initiating pairing13,14,15,52. In brief, although we found no definitive evidence of homolog pairing in early mouse embryos, our data nevertheless leave this issue open for future
studies. Also, as repetitive sequences were excluded from our analyses, the potential of _trans_-homolog contacts at repeats remains to be explored. DISCUSSION To conclude, our study
addressed the fundamental nature of chromosome pairing and, to this end, developed a robust method, Ohm, for conducting haplotype-resolved Hi-C studies wherein interactions between
homologous chromosomes are carefully vetted for homolog misassignment. This approach ensured the highest quality assignments of parental origin to Hi-C reads when distinguishing _cis_ from
_trans_ contacts, and can be extended to any number of other methods53. Using Ohm, we obtained, for the first time, a genome-wide high-resolution view of homolog pairing during early
_Drosophila_ development. Our data revealed genome-wide juxtaposition of homologs along their entire lengths as well as a multi-layered organization of _trans_-homolog domains, domain
boundaries, compartments, and interaction peaks. We also observed concordance of _trans_-homolog and _cis-_ features, arguing that _cis_ and _trans_ interactions are structurally coordinated
(see also31). This striking correspondence of _trans_-homolog and _cis_ domain boundaries and interaction peaks may suggest similar mechanisms of their formation. For instance, SMC
complexes implicated in loop extrusion54, formation of _cis_ domains, and cohesion of sister chromatids in mammals may play a role in pairing and formation of _trans_-homolog domains in
_Drosophila_. We pursue this line of thought in our companion paper31. Moreover, by layering _trans_-homolog contacts on models of genome organization that have relied primarily, if not
solely, on _cis_ contacts, our findings highlight how haplotype-resolved Hi-C can shed light on paradigms of genome organization and function that would otherwise remain hidden. For example,
pairing may underlie some of the structural and regulatory differences between the 3D architecture of the _Drosophila_ genome and that of organisms lacking pairing; indeed, the close
proximity of homologs may influence the manner in which loops and domains are formed in _Drosophila_ in addition to playing a role in gene regulation2,31,55. Our observations have further
revealed a correlation between pairing and Zelda-mediated chromatin accessibility during zygotic genome activation. In this way, they champion a relationship between _trans_-homolog genome
organization and key developmental decisions, aligning well with the growing recognition that pairing can play a potent role in gene regulation, even at some loci in mammals (reviewed
by1,2). As such, it may be of significance that homologs are unpaired during the earliest moments of _Drosophila_ embryogenesis56 and then initiate pairing at a time coinciding with
activation of the zygotic genome. This in mind, we examined data pertaining to early mouse embryo; as in _Drosophila_, murine maternal and paternal genomes are segregated in the earliest
cell cycles25,26,48,49,50, but little is known about the genome-wide status of pairing thereafter. Our analyses were further fueled by studies suggesting that pairing may be a general
mechanism by which organisms detect structural heterozygosity in their genomes early in development, culling those that are deleteriously rearranged57. Although we observed some intriguing
signals, ultimately, the sparsity of data did not allow us to draw strong conclusions regarding pairing in the mouse embryos, pointing to a need for additional haplotype-resolved Hi-C
analyses and/or the resolution provided by imaging. Our studies also suggest how pairing in _Drosophila_ could shape early nuclear organization of the zygotic genome. For instance, as
pairing brings similar loci together, it may enhance the compartmentalization of heterochromatic and euchromatic structures during phase separation in early _Drosophila_ embryos58.
Alternatively, the segregation of heterochromatin from euchromatin could facilitate homology searches during the initiation of pairing. Indeed, how homologs identify each other remains one
of the most intriguing questions. For instance, do homologs become structurally similar because of pairing, or do they have comparable conformations prior to pairing, their similarities
contributing to homolog recognition? As our results do not reveal striking differences between the _cis_ maps of homologs, they are consistent with the latter scenario. However, because our
_cis_ maps likely represent a mix of paired and unpaired homologs, potential differences between the _cis_ maps of homologs may only become apparent in younger embryos prior to pairing.
Finally, we note that the sensitivity of Ohm has potential usefulness also for the analysis of _trans_ contacts between heterologous chromosomes, which would fall in the plane of _x_ = 0 in
our framework of precision (x), proximity (y), and continuity (z). Intriguingly, it may be that, in some instances, only one of two alleles participates in heterologous interactions
(reviewed by59), and thus, here, our haplotype-resolved approach could be applied to dissect the parental origin of the interacting alleles. Of course, when our framework is extended to
encompass the dimension of time, it should then be able to capture the dynamics of _trans_-homolog and _trans_-heterolog contacts through cell division, development, aging, and disease.
METHODS SELECTION OF PARENTAL _DROSOPHILA_ LINES To be able to distinguish homologs in sequencing data, we selected two parental lines with a high number of SNVs from _Drosophila
melanogaster_ Genetic Reference Panel (DGRP), which contains _Drosophila_ lines inbred over 20 generations (see Supplementary Note 1). GENOMIC DNA ISOLATION AND LIBRARY PREPARATION 20 adult
flies from each parental line (the Bloomington stock numbers 29652 and 29658) were homogenized with motor (Kimble-Kontes Pellet Pestle Cordeless Motor) and pestle (Kimble-Kontes) on ice.
Genomic DNA was isolated using DNeasy Blood & Tissue Kit (Qiagen) according to manufacturers’ recommendations. The integrity of the isolated genomic DNA (i.e. no degradation present) was
verified by running a 1% agarose gel. Genomic DNA libraries were generated using Illumina TruSeq Nano DNA Library Preparation kit, and were 150 bp paired-end sequenced at the TUCF Genomics
Facility using Illumina HiSeq2500. COLLECTION AND FIXATION OF THE F1 HYBRID EMBRYOS The _Drosophila_ handling was in accordance with the Harvard Medical School guidelines. The inbred
DGRP-057 (maternal) and 439 (paternal) lines were mated to obtain the F1 hybrid embryos. To ensure that accurate parental genotypes were crossed, around 28,000 males and 28,000 virgin
females were manually sorted. The F1 hybrid embryos were collected and fixed after three pre-lays followed by aging for 2–4 h time-point at 25 °C. To validate that the embryos were of the
correct stage, and did not contain contaminants from older embryos, a small aliquot (~100 embryos) per collection was set aside, devitellinised, and stored in methanol at −20 °C to verify
developmental stages of collection under microscope. If even a single older embryo was noted, collection was discarded, as that embryo may contribute more nuclei than 2–4 h embryo, depending
on exact developmental difference between them. The remaining embryos from collections were snap-frozen in liquid nitrogen and stored at −80 °C. IN SITU HI-C ON _DROSOPHILA_ F1 HYBRID
EMBRYOS Hi-C protocol from Rao et al.19 was adapted for the _Drosophila_ embryos. 30 mg of snap-frozen fixed embryos were homogenized with pestle (Kimble-Kontes) in 500 μl of ice-cold lysis
buffer, and incubated 30 min on ice. Upon cell lysis, the chromatin was digested using 500 U of DpnII restriction enzyme overnight at 37 °C. The DpnII overhangs were filled in with biotin
mix during 1.5 h at 37 °C, and the chromatin was ligated for 4 h at 18 °C. RNA was degraded by adding 5 μl of 10 mg/ml RNase A (ThermoFisher Scientific) followed by incubation for 30 min at
37 °C. After degradation of proteins and crosslink reversal overnight at 68 °C, DNA was ethanol precipitated. DNA shearing was performed to obtain around 400–600 bp fragments with Qsonica
Instrument (Q800R) using the following parameters: 30 s on/off, 15x cycles, 70% ampl. After size-selection to around 500 bp, biotin pull-down was performed with a minor modification. Namely,
the size-selected DNA was eluted in 200 μl of 10 mM Tris-HCl pH 8.0, and was mixed with equal volume of 2x Binding Buffer (10 mM Tris-HCl pH 7.5, 1 mM EDTA, 2 M NaCl) containing pre-washed
Dynabeads MyOne Streptavidin T1 beads (Life Technologies). The library preparation19 was performed with the following modifications. The adapter ligation was in 46 μl of 1x Quick ligation
reaction buffer (NEB), 2 μl of DNA Quick ligase (NEB), and 2 μl of NEXTflex DNA Barcode Adapter (25 μM, NEXTflex DNA Barcodes −6, Bioo Scientific #514101). PCR reaction contained 23 μl of
adaptor ligated DNA, 2 μl of NEXTflex Primer Mix (12.5 μM), and 25 μl NEBNext Q5 Hot Start HiFi PCR Master Mix (NEB), and was run using the program: 98 °C, 30 s, (98 °C, 10 s, 65 °C, 75 s)
repeated 7 times, 65 °C, 5 min, hold at 4 °C. Purification of PCR products was performed by incubation for 15 min instead of 5 min after each addition of Agencourt AMPure beads. The final
libraries were eluted in 15 μl of 10 mM Tris-HCl pH 8.0 after 15 min incubation at room temperature, and 15 min incubation on a magnet. The library quality was assessed using the High
Sensitivity DNA assay on a 2100 Bioanalyzer system (Agilent Technologies). The libraries corresponding to two independent biological replicates were 150 bp paired-end sequenced at the TUCF
Genomics Facility using Illumina HiSeq2500. FISH PROBES Oligo probes for heterochromatin repeats at chr2 (AACAC), chr3 (dodeca) and chrX (359)60 were synthesized by Integrated DNA
Technologies (IDT) with the following sequences and a fluorescent dye: AACAC (Cy3-AACACAACACAACACAACACAACACAACACAACAC), dodeca (FAM488-ACGGGACCAGTACGG), and 359
(Cy5-GGGATCGTTAGCACTGGTAATTAGCTGC). The libraries for euchromatin probes 89D-89E/BX-C (315 kb), 2R16 (904 kb), 3R7 (844 kb), 3R19 (700 kb), 69 C (674 kb), and 28B (680 kb) were designed
using Oligopaint technology (Supplementary Table 4)17,61,62, and were amplified using T7 amplification (see section Oligopaint probe synthesis) with forward primers containing a site for
secondary oligo annealing, and reverse primers containing a T7 promoter sequence (sequences are provided in Supplementary Table 5). DNA secondary oligos61, which were used together with
primary probes, had both 5′ and 3′ conjugated fluorophores (Supplementary Table 5). OLIGOPAINT PROBE SYNTHESIS Oligopaints probes were synthesized using T7 amplification followed by reverse
transcription63. Oligopaints libraries were first amplified with Kapa Taq enzyme (Kapa Biosystems, 5 U/μl), and corresponding forward and reverse primers (without the site for secondary
oligo annealing and the T7 promoter, i.e. without the underlined sequences from Supplementary Table 5) using linear PCR program as follows: 95 °C, 5 min, (95 °C, 30 s, 58 °C, 30 s, 72 °C, 15
s) repeated 25 times, 72 °C 5 min, hold at 4 °C. Upon clean up with DNA Clean & Concentrator-5 (DCC-5) kit (Zymo Research), this PCR was followed by another bulk up PCR using the same
program, but this time to introduce the site for secondary oligo annealing to the forward strand, and the T7 promoter to the reverse strand (primers used with the underlined sequences from
Supplementary Table 5). The PCR product with added T7 promoter was cleaned up using DNA Clean & Concentrator-5 (DCC-5) kit (Zymo Research), and became a template in T7 reaction to
produce excess RNA with HiScribe T7 High Yield RNA Synthesis Kit (NEB) and RNAseOUT (ThermoFisher Scientific) overnight at 37 °C. RNA was then reverse transcribed into DNA with Maxima H
Minus RT Transcriptase (ThermoFisher Scientific) in a 2 h reaction at 50 °C, followed by the inactivation of the RT enzyme at 85 °C for 5 min. Subsequently, RNA was degraded via alkaline
hydrolysis (0.5 M EDTA and 1 M NaOH in 1:1) for 10 min at 95 °C, and ssDNA was purified with DNA Clean & Concentrator-5 (DCC-5) kit (Zymo Research), where DNA binding buffer was replaced
with Oligo binding buffer (Zymo). FISH IN EMBRYOS FISH in _Drosophila_ embryos17,61 was performed with modifications. Embryos were dechorionated with 50% bleach for 2.5 min, washed with
0.1% Triton X-100 in PBS, and fixed for 30 min in 500 μl of fix (PBS containing 4% formaldehyde, 0.5% Nonidet P-40, and 50 mM EGTA), plus 500 μl of heptane. Upon replacing the aqueous phase
with methanol, embryos were vigorously shaken for 2 min. Finally, embryos were triple washed with 100% methanol, and stored at −20 °C in methanol. Prior to FISH, embryos were gradually
rehydrated in 2x SSCT (0.3 M NaCl, 0.03 M NaCitrate, 0.1% Tween-20). Subsequently, embryos were incubated for 10 min in 2x SSCT/20% formamide, followed by another 10 min in 2x SSCT/50%
formamide, and then hybridized in a hybridization solution (2x SSCT, 50% formamide, 10% dextran sulphate, RNase) with primary Oligopaint probe set (200 pmol for heterochromatin and 300 pmol
for euchromatin probes) for 30 min at 80 °C, and then at 37 °C overnight. After primary probe hybridization, two 30 min washes in 2x SSCT/50% formamide were performed at 37 °C. In a case
secondary probe was used, secondary hybridization was performed between those two washes for 30 min in 2x SSCT/50% formamide with 300 pmol of secondary probe at 37 °C. The washes were
continued in 2x SSCT/20% formamide for 10 min at RT, and with three rinses in 2x SSCT. The embryos were stained with Hoechst 33342 (Invitrogen), washed in 2x SSCT for 10 min at RT, quickly
rinsed in 2X SSC, and mounted in SlowFade Gold antifade mountant (Invitrogen). Images were taken using a Zeiss LSM780 laser scanning confocal microscope with a ×63 oil NA 1.40 lens at 1024 ×
1024 resolution. ANALYSIS OF FISH SIGNALS The analysis was performed by manually examining each section of Z-stack with the Zeiss ZEN Software. Distance in 3D space between two FISH signals
was measured using the Ortho-distance function in the Zeiss ZEN Software. Two homologs were considered paired if 3D distance between centers of two FISH signals was ≤0.8 μm or there was
only one FISH signal. GENERATION OF ZLD-DEPLETED EMBRYOS The _UAS-shRNA-zld_41 virgin females were crossed to the maternal triple driver Gal4 (_MTD-Gal4_, the Bloomington stock number 31777)
males. The F1 heterozygous females _UAS-shRNA-zld_ /_MTD-Gal4_ were then mated to their sibling males, and the F2 Zld-depleted embryos were collected, and fixed as described in the section
FISH in embryos. The control embryos were obtained using the same crossing scheme just by replacing the _MTD-Gal4_ with the wild-type Canton S males. To validate that embryos were of the
correct genotype, a small aliquot (~500 embryos) was inspected under microscope for both Zld-depleted and control samples. THE CONSTRUCTION OF F1 DIPLOID _DROSOPHILA_ GENOME We sequenced the
two inbred parental _Drosophila_ lines (DGRP-057 and DGRP-439) together with the hybrid PnM cell line31 at the average coverage of 118, 117, and 396 reads per base pair, respectively64. We
then detected the sequence variation of these three libraries using _bcftools_. In summary, we obtained high-quality normalized sequence variants as following: * 1. Trimmed low-quality
sequences with seqtk trimfq, aligned whole-genome paired-end reads against the reference dm3 genome using BWA mem, and removed aligned PCR duplicates with samtools –rmdup. * 2. Piled
alignments up along the reference genome with bcftools pileup –min-MQ 20 –min-BQ 20. * 3. Called raw sequence variants from the pileups with bcftools call. * 4. Normalized raw sequence
variants with bcftools norm. * 5. Selected only high-coverage high-quality normalized sequence variants using bcftools filter INFO/DP > 80 & QUAL > 200 & (TYPE = “SNV”|IDV >
1). We then phased heterozygous PnM variants using bcftools isec. We picked high-confidence variants on the maternal autosomes by selecting heterozygous PnM variants that were present among
maternal DGRP-057 variants and absent among paternal DGRP-439 sequence variants (both homo- and heterozygous); the high-confidence paternal variants phasing was selected in an opposite
manner. Since PnM is a male line, for the maternal copy of chrX in F1 embryos, we considered only homozygous high-quality variants detected in the PnM cell line. To reconstruct the consensus
sequence of the paternal copy of chrX in F1 embryos, we kept only homozygous variants detected in the paternal DGRP-439 _Drosophila_ line. Finally, we reconstructed the sequence of the F1
embryos with samtools consensus, using (a) the homozygous autosomal PnM SNVs, (b) the heterozygous phased autosomal PnM SNVs, and (c) the homozygous maternal chrX PnM SNVs as well as the
homozygous SNVs detected in the paternal DGRP-439 _Drosophila_ line. MAPPING AND PARSING We started with sequences of Hi-C molecules and trimmed low-quality base pairs at both ends of each
side using the standard mode of _seqtk trimfq_ v.1.2-r94 (https://github.com/lh3/seqtk). Then we mapped the trimmed sequences to the reference dm3 genome or the constructed dm3-based F1
diploid genome using _bwa mem_ v.0.7.1565 with flags -SP. We then extracted the coordinates of Hi-C contacts using the _pairtools parse_ command line tool
(https://github.com/mirnylab/pairtools). We only kept read pairs that mapped uniquely to one of the two homologous chromosomes and removed PCR duplicates using the standard mode of the
_pairtools dedup_ command line tool. CONTACT FREQUENCY (P(S)) CURVES We used unique Hi-C pairs to calculate the functions of contact frequency P(s) _vs_ genomic separations. We grouped
genomic distances between 10 bp and 10 Mb into ranges of exponentially increasing widths, with 8 ranges per order of magnitude. For every range of separations, we found the number of
observed _cis_- or _trans_-homolog interactions within this range of separations and divided it by the total number of all loci pairs separated by such distances. We used a similar technique
to quantify the degree of coalignment of chromosomal arms due to Rabl configuration (Fig. 3h). Specifically, the Rabl configuration increased the contact frequency between pairs of loci
located at the same relative positions along different chromosomal arms. We characterized this tendency by calculating a P(s) on _trans_-heterolog maps, where we calculated the position
mismatch as _s_ = _x_1 − _x_2/_L_2 ×_L_1, where _x_1 and x2 were the distances from each locus to the centromere and L1 and L2 were the lengths of the two chromosomal arms. ESTIMATING THE
RATE OF HI-C BYPRODUCTS Each Hi-C dataset contains non-informative byproducts, i.e. sequenced DNA molecules that originate from a single DNA fragment, and thus do not carry any information
on chromatin conformation (unlike informative Hi-C molecules that form via a ligation of two spatially proximal DNA fragments and capture a spatial contact) (Supplementary Fig. 3a, b). The
two well-known types of Hi-C byproducts are: (i) unligated DNA fragments (termed “dangling ends”) and (ii) self-ligated DNA fragments (“self-circles”)37. “Dangling ends” are small pieces of
intact unligated DNA that passed through all selection steps of the Hi-C protocol and ended up in the library of sequenced molecules (Supplementary Fig. 3b). “Dangling ends” appear as _cis_
read pairs at s ~100–1000 bp (such molecules are left in the library after the size selection step of the Hi-C protocol), with the direction of the two reads of a read pair pointing towards
each other along the reference genome. “Self-circles” are pieces of DNA whose ends were ligated to each other and the resulting circular DNA had a break in another location, producing a
linear piece of DNA (Supplementary Fig. 3b). “Self-circles” also appear in _cis_, but at longer separations, up to a few kb (this distance depends on the frequency of the restrictions sites
along the genome) and the resulting paired read orientations point away from each other along the reference genome37. Because both of these types of byproducts were characterized by their
narrow range of genomic separations and a specific mutual orientation of the paired end reads (Supplementary Fig. 3b), their abundance was estimated using P(s) curves for four possible
combinations of the directionality of paired read ends (Supplementary Figs 3c and 4a). In such plots, “dangling ends” produced a characteristic 100 × −1000x enrichment of inward read pairs
below 1 kb separation and “self-circles” produced a weaker enrichment of outward read pairs at separations up to 10 kb, though their amount and typical genomic separation seemed to vary
greatly between different experimental protocols (Supplementary Figs. 3c and 4a)37. During the work on this manuscript, we also discovered a third, previously undescribed type of a Hi-C
byproduct. We found that the read pairs that aligned to the same genome strand (i.e. same-strand read pairs) were enriched at _s_ < 500 bp. Upon closer examination, we found that such
short-distance same-strand read pairs shared a similar unique pattern: while one of the two reads were typically fully aligned to some locus on the genome, the other read would split into
two fractions, which would align to different locations. The inner, 3′ fraction mapped in _cis_, downstream and opposite to the read on the first side (as in a “dangling end”); while the
outer, 5′ fraction overlapped the inner fraction, but went into the opposite direction (Supplementary Fig. 3d). This non-trivial alignment pattern suggested a scenario, where, during some
stage of the Hi-C protocol, a DNA molecule formed a hairpin and was extended using itself as a template (Supplementary Fig. 3e). During the work on this manuscript, this type of a Hi-C
byproduct was independently reported and thoroughly characterized in66, who dubbed it as “hairpin loops”. Another, older study reported formation of similar hairpin loops in whole-genome
sequencing of ancient DNA67. The mechanism by which such “hairpin loops” form remains to be firmly established. Golloshi et al.66 proposed that these “hairpin loops” were formed during the
end repair stage of the Hi-C protocol via self-annealing of a pre-existing microhomology region followed by an elongation by the T4 polymerase. If this hypothesis was true, then “hairpin
loops” should form with equal probability on all Hi-C molecules, regardless of the orientation and relative location of the ligated fragments, as well as on “dangling ends” and
“self-circles”. The enrichment in short distance same-strand read pairs would then be most likely due to formation of “hairpin loops” on “dangling ends”, which is a highly enriched
substrate. Importantly, we can still identify the ligated fragments even in Hi-C molecules with “hairpin loops”. First, the extra base pairs introduced by a “hairpin loop” map to the same
location as the substrate (albeit at the opposite direction) and their alignment can serve as a proxy for the location of the substrate. Second, provided a sufficient long read length, we
can simply ignore these extra pairs and instead align the inner fraction of the Hi-C molecule, which served as a substrate for the “hairpin loop”. Thus, “hairpin loops” represent the most
benign type of a Hi-C byproduct and their presence does not significantly reduce the number and identity of contacts extracted from a Hi-C library. We produced an upper estimate of the
amount of byproduct types in our sample, assuming that the true P(s) followed that of the same-strand read pairs at _s_ > 1 kb, and was constant at s<1 kb. Using this assumption, we
found that “dangling ends” constituted 39.5% of mapped and phased reads in our Hi-C librarys, “self-circles” were 0.3%, and “hairpin loops” formed from “dangling ends” made up 2.9% of the
library. BINNING AND BALANCING OF HI-C DATA We aggregated unique Hi-C pairs into genomic bins of 1 kb and larger, using the cooler package (https://github.com/mirnylab/cooler). Low signal
bins were excluded prior to balancing using the MADmax filter: we removed all bins, whose coverage was 7 genome-wide median deviations below the median bin coverage. Additionally, we removed
all _cis_- and _trans_-homolog contacts at separations below 3 kb, since these reads pairs were dominated by non-informative Hi-C artifacts, unligated DNA fragments and ligation sites
formed via self-circularization of DNA fragments68. We then balanced the obtained contact matrices via iterative correction (IC), i.e. equalized the sum of contacts in every row/column to
1.0. We calculate observed/expected contact frequency maps (often abbreviated as O/E CF) in _cis_ and _trans_-homolog by dividing each diagonal of an IC contact map by its chromosome-wide
average value over non-filtered genomic bins. THE DEFINITION OF HOMOLOG MISASSIGNMENT When we aligned a read to a diploid genome, we assigned to it three bits of information: which pair of
homologous chromosomes this read originated from; the allele, _i.e_. which of the two homologs it originated from, and its location along the chromosome. Importantly, we could assign the
allele (or, the homolog) to a read only if it overlapped some sequence that is unique to one homolog, i.e. if it overlapped a SNV; otherwise, it was impossible to tell which of the two
homologs the read originated from. Even in the _Drosophila_ and mouse models with the highest density of SNVs, the sequences of the two homologous chromosomes were still highly similar and
contained only one SNV per 100–200 bp. Because of that, the majority of read pairs (150 bp) lacked allele assignment on one or both sides; and the allele assignment for the rest of pairs was
based on one or a few SNVs, and thus was prone to errors. SOURCES OF HOMOLOG MISASSIGNMENT The errors in allele assignment (below, homolog misassignment, HM) occur for two reasons: (A) due
to an error in the sequence of the read, or (B) due to an error in the sequence of the genome. Below we discussed how such errors lead to HM. Also, note that we only discussed the case where
diploid genome sequences only contained SNVs and did not analyze the effect of insertions, deletions and duplications. * (A) The type and rate of sequencing errors varies highly among
different sequencing platforms69. In the case of the most popular short-read platform, Illumina, sequencing errors typically lead to substitutions at the rate around 0.1% per base pair69.
Such a substitution could occasionally lead to a HM, if it occurs at a SNV site and the erroneously called base pair by chance matches the other SNV allele. * (B) Some types of errors in the
sequence of a diploid genome may lead to HM. The possible cases are: * (B1) an error at a site without a SNV (e.g. the true sequence is A in both alleles, which we wrote as A-A, but in the
genome database it is T-T)—in this case, reads coming from either homolog would contain a mismatch with the database. Such error does not lead to HM. * (B2) a missing SNV (e.g. true A-T, but
in the database it is A-A). Such an error leads to mapping imbalance, _i.e_. reads from the homolog with the correct sequence would get mapped, while the reads from a homolog with a
sequence error will be dropped. A missing SNV does not lead to HM. * (B3) a false positive SNV (e.g. true A-A, database A-T). In this case, reads from both homologs will be assigned to the
same allele (the one matching the true sequence). A false positive SNV error leads to both HM and mapping imbalance. * (B4) an erroneous SNV (e.g. true A-T, database A-C). In this case,
reads from the homolog containing an error will not be mapped, which will produce mapping imbalance. An erroneous SNV does not lead to HM. * (B5) missing heterozygosity of an SNV allele.
Samples derived from populations of organisms can contain heterozygous SNVs, _i.e_. different organisms within the population may contain different base pairs at the same location on the
same homolog. The issue, however, is that genomic databases can store only one allele per homolog (below, referred to as a “known” allele), while the other alleles become ignored (referred
to as “unknown” alleles) (note that this issue can be solved by using graph genomes, which can store multiple overlapping variants per position70). The effects of heterozygosity on mapping
depends on the nature of “known” and “unknown” alleles on the two homologs: * (B5.1) non-overlapping “known” and “unknown” alleles, when all alleles of one homolog are different from the
allele on the other homolog (e.g., true A/C-T, database A-T). This scenario leads to a partial mapping imbalance, because the reads containing the “unknown” allele do not get mapped. This
does not lead to HM. * (B5.2) overlapping “known” and “unknown” alleles, when the “unknown” allele on one homolog is the same as the “known” allele on the other homolog (e.g. true A/T-T,
database A-T). This scenario leads to HM, because all reads containing the “unknown” allele will be interpreted as containing the “known” allele from the other homolog. Also, this scenario
leads to a mapping imbalance. MISASSIGNED _CIS_ PAIRS CAN CONTAMINATE _TRANS_-HOMOLOG SIGNAL HM is particularly problematic for studying the _trans_-homolog contact patterns. If we would
assign a wrong homolog to one side of a _cis_ Hi-C pair, we would misinterpret this pair as a _trans_-homolog contact. Given that _trans_-homolog contacts in our sample were much less
frequent than _cis_ ones, even a small probability of HM could lead to a significant contamination of the _trans_-homolog contact map. Note, that a cross-contamination between the _cis_ maps
of the two homologs was much less likely, since it required simultaneous HM on both sides of a Hi-C pair. ESTIMATING HOMOLOG MISASSIGNMENT USING HI-C BYPRODUCTS The observed _trans_-homolog
read pairs thus was a mixture of “true” _trans_-homolog contacts and _cis_ pairs with a misassigned homolog on one side. For P(s) curves, this could be expressed as: $${\mathrm{P}}_{trans -
{\mathrm{homolog}}}\left( s \right)^{{\mathrm{obs}}} = \left( {1 - \mathrm{P}_{{\mathrm{HM}}}} \right) \ast {\mathrm{P}}_{trans - {\mathrm{homolog}}}\left( s \right)^{{\mathrm{true}}} +
\mathrm{P}_{{\mathrm{HM}}} \ast \mathrm{P}_{{\mathrm{cis}}}\left( \mathrm{s} \right),$$ (1) where P_trans_-homolog(s)obs was the P(s) curve for the observed _trans_-homolog contacts,
P_trans_-homolog(s)true was that for the _true trans_-homolog contacts (_i.e_. Hi-C _trans_-homolog pairs that represented a true _trans_-homolog ligation) and P_cis_(s) was P(s) for _cis_
contacts, and PHM was the probability of HM. Here, the probability of HM was defined per paired read (_i.e_. the probability per side is a PHM/2); we assumed that each Hi-C pair had the same
chance to get an erroneously assigned homolog, regardless of its genomic separation or orientation, _i.e_. that HM probability was the same for all Hi-C pairs. We also accounted for HM in
_trans_-homolog read pairs, which were falsely interpreted as _cis_ ones. Estimating the probability of HM in a mapped Hi-C library was a challenging task. A priori, for any given
_trans_-homolog read pair, we cannot tell if it was produced by a true _trans_-homolog ligation, or it resulted from HM of a _cis_ pair. However, we could reduce the relative amount of
homolog-misassigned pairs by increasing the stringency of homolog assignment. For that purpose, we selected pairs where both sides overlapped at least two or three SNVs and where read
alignments had no mismatches with respect to the reference genome. We reasoned that, for such pairs, HM was less likely, since it required simultaneous errors at multiple SNVs. For pairs
with 2 + SNVs on each side, the shape of P_trans_-homolog(s) changed at separations <1 kb: the ~10-fold enrichment of _trans_-homolog inward pairs at s < 1 kb that was present in
unfiltered data (Supplementary Fig. 4a), was greatly reduced after increasing the stringency of homolog assignment (Fig. 2c and Supplementary Fig. 4b). We tried increasing the stringency of
homolog assignment further by requiring 3 + SNVs on each side, but this did not change the shape of P_trans_-homolog(s) (Supplementary Fig. 4c). This observation suggested that the
homolog-misassigned _cis_ pairs did not significantly contribute to P_trans_-homolog(s) for pairs with 2 + SNVs. Conversely, decreasing the accuracy of homolog assignment by remapping our
data to less accurate DGRP SNV annotations (see Supplementary Note 1), increased the abundance of observed short-distance inward _trans_-homolog pairs (Supplementary Fig. 4d). We concluded
that the enrichment of short-distance inward _trans_-homolog pairs was due to homolog-misassigned inward _cis_ pairs. Inward _trans_-homolog pairs at _s_ < 1 kb were particularly
sensitive to contamination by homolog-misassigned _cis_ pairs, because at these separations and directionalities _cis_ pairs were the most abundant (>104 more abundant that
_trans_-homolog pairs of other directionalities) due to “dangling ends”. Thus, even rare HM at a probability as low as ~10−4 would generate enough false _trans_-homolog pairs to match the
true signal, and thus change the shape of inward P_trans_-homolog(s) at _s_ < 1 kb. Thus, the ratio of P_trans_-homolog(s)/P_cis_(s) for inward pairs at short separations could be used as
an upper estimate for the probability of HM: $${\mathrm{P}}_{{\mathrm{HM}}} \le < {\mathrm{P}}_{trans - {\mathrm{homolog}}}\left( \mathrm{s}
\right)^{{\mathrm{inward}}}/{\mathrm{P}}_{cis}\left( \mathrm{s} \right)^{{\mathrm{inward}}} > _{300{\mathrm{bp}} < {\mathrm{s}} < 600{\mathrm{bp}}},$$ (2) where
<…>300bp<s<600bp was the geometric mean around the range of separations between 300 bp and 600 bp, corresponding to the “dangling end” peak of P_cis_(s). Using this approach, we
estimated the HM probability in our data at ~0.17% (Fig. 2d). Importantly, this was an _upper_ estimate, since not all of the _trans_-homolog inward pairs at s < 1 kb were
homolog-misassigned _cis_ pairs. Finally, given this probability, misassigned _cis_ contacts (the second term in Eq. (1)) made up only 5% of detected _trans_-homolog contacts at s~1 kb
separations (Fig. 2e) and even less at larger separations. ANALYSIS OF PUBLISHED HAPLOTYPE-RESOLVED MOUSE HI-C DATA We tested our Ohm approach to haplotype-resolved Hi-C using data from two
published haplotype-resolved Hi-C studies on mice25,26. For mapping, we reconstructed two sets of diploid genomes (Black6 x DBA/2J and Black6 x PWK/PhJ) using SNVs from the Mouse Genome
Project71. The genome of Black6 parental mouse line did not require reconstruction, since it served as the basis for the reference mm10/GRCm38 genome. We reconstructed consensus genomes with
bcftools consensus, using only homozygous SNVs that passed the quality control. We then mapped the publicly available sequenced Hi-C libraries to the diploid genomes (Black6 x DBA/2J for26
and Black6 x PWK/PhJ for25) and extracted the positions of Hi-C contacts using the same approach as for our _Drosophila_ data. For contact maps, we only used Hi-C pairs overlapping 2 + SNVs
on each side. We did not perform IC on the produced contacts maps due to their sparsity. Non-ICed raw contact maps have to be interpreted with a degree of caution, since they are affected by
the variation of sequencing visibility of loci due to an uneven distribution of SNVs, GC content, amount of open chromatin, etc. In a naive interpretation, a decay of _trans_-homolog
contact frequency P_trans_-homolog(s) with distance s is indicative of homolog pairing, since it means that pairs of loci in homologous positions make more contacts than loci in
non-homologous positions. However, such decay can also be observed in samples without pairing, but due to severe contamination of _trans_-homolog contacts by homolog-misassigned _cis_ pairs.
To interpret the curves of _trans_-homolog contact frequency P_trans_-homolog(s), we compared them to a negative control, no-pairing curves P_trans_-homolog(s)no-pairing, which described
the expected amount of observed _trans_-homolog contacts in samples without pairing, but in presence of HM. P_trans_-homolog(s)no-pairing could be derived from Eq.(1) assuming
P_trans_-homolog(s)true = const: $${\mathrm{P}}_{trans - {\mathrm{homolog}}}\left( s \right)^{{\mathrm{no}} - {\mathrm{pairing}}}\sim {\mathrm{avg}}.{\mathrm{cross}} -
{\mathrm{parent}}\,trans - {\mathrm{heterolog}}\,{\mathrm{CF}} + \mathrm{P}_{{\mathrm{HM}}} \ast \mathrm{P}_{cis}\left( s \right),$$ (3) here, we could estimate PHM using Eq. (2). Thus, in
order to claim that a sample had homolog pairing, we had to observe significantly more contacts than that predicted by P_trans_-homolog(s)no-pairing, at least in some range of separations.
ANALYSIS OF PUBLISHED HI-C DATA FROM _DROSOPHILA_ EMBRYOS To compare our data with other studies on the structure of chromosomes in _Drosophila_ embryos, we re-analysed the publicly
available Hi-C dataset from33 using the same methods as we used for our own data. PAIRING SCORE To characterize the degree of pairing between homologous loci across the whole genome, we
introduced a genome-wide statistics track called _pairing score (PS)_. The PS of a genomic bin is log2 of average _trans_-homolog IC contact frequency between all pairs of bins within a
window of ±W bins. For each genomic bin i, its pairing score with window size W was defined as: $${\mathrm{PS}}^{\mathrm{W}}\left( {\mathrm{i}} \right) = {\mathrm{log}}_2 <
{\mathrm{CF}}_{{\mathrm{m}},{\mathrm{n}}} > ,$$ (4) averaged over bins _m_ and _n_ between i-W-th and i + W-th genomic bins on different homologs of the same chromosome. Importantly,
under this definition, the PS quantified only contacts between homologous loci and their close neighbors and did not quantify pairing between non-homologous loci on homologous chromosomes.
The choice of the window size W was guided by the balance between specificity and sensitivity. Using a bigger window increased sensitivity, accumulating contacts across more loci pairs,
while smaller windows increased specificity, allowing to see smaller-scale variation of homolog pairing; empirically, we found that, for our contact maps binned at 4 kb resolution, using a 7
× 7 bin window (_W_ = 3) provided the optimal balance between specificity and sensitivity. A close examination of the PS track revealed two important features: (i) the _Drosophila_ genome
was divided into regions that demonstrate consistently high, relatively similar, values of PS, followed by extended regions where PS dipped into lower values, (ii) switching between high-
and low-PS regions seemed to occur around insulating boundaries. INSULATION SCORES For every bin of a contact map binned at 4 kb resolution, we calculated the insulation score as the total
number of normalized and filtered contacts formed across that bin by pairs of bins located on the either side, up to 5 bins (20 kb) away for Hi-C mapped to reference dm3 maps, and up to 10
bins (40 kb) away for haplotype-resolved Hi-C maps (see Supplementary Note 1). We then normalized the score by its genome-wide median. To find insulating boundaries, we detected all local
minima and maxima in the log2-transformed and then characterized them by their prominence (Billauer E. peakdet: Peak detection using MATLAB, http://billauer.co.il/peakdet.html). The detected
minima in the insulation score corresponded to a local depletion of contacts across the genomic bin, were then called as insulating boundaries. We found empirically that the distribution of
log-prominence of boundaries had a bimodal shape, and we selected all boundaries in the high-prominence mode above a prominence cutoff of 0.1 for Hi-C mapped to the reference dm3 map, and a
cutoff of 0.3 for haplotype-resolved Hi-C maps. We called the insulating boundaries in _trans_-homolog contact maps using the same technique, requiring a minimal prominence of 0.3. Finally,
we removed boundaries that were adjacent to the genomic bins that were masked out during IC. To estimate the similarity of insulating boundaries detected in the _cis_ and _trans_-homolog
contact maps, we calculated the number of overlapping boundaries. We allowed for a mismatch up to four genomic 4 kb bins (16 kb total) between overlapping boundaries to account for the drift
caused by the stochasticity of contact maps. We reported average percentage of overlapping boundaries. For instance, the average fraction (73.9%) that overlapping boundaries between _cis_
maternal and _cis_ paternal boundaries occupied within _cis_ maternal only (74.2%), and _cis_ paternal only boundaries (73.7%). Similarly, for replicates, we calculated the average
percentage of overlapping boundaries for _cis_ maternal replicates (75.4%), and also for _cis_ paternal replicates (71.1%), and then provided a mean of the two values (73.2%). In reference
dm3 Hi-C contact maps, the percentage of overlapping boundaries between the two replicates reached 92.3%, suggesting that the lower reproducibility of haplotype-resolved boundaries is due to
technical and not biological variation between the two replicates. We estimated the significance of an overlap between two given boundary sets by comparing it to the overlap expected by
chance alone, given the sizes of the two sets. We estimated the latter by calculating an overlap between two similarly-sized random subsets of genomic bins visible in our Hi-C maps. To
estimate how significantly the observed overlap deviates from the random expectation, we repeated randomization 10 times and compared the random overlaps to the observed overlap using a
t-test. CHIP-SEQ We mapped the publicly available raw ChIP-seq data following the same procedure as used by the ENCODE consortium72, (https://github.com/ENCODE-DCC/chip-seq-pipeline). To
calculate the number of overlapping ChIP-seq peaks, we re-sized all peaks to 1 kb around their centers and used pyBedTools to calculate peak intersections73. To generate the tracks of Zld
binding, we used ChIP datasets GSM1596215 and GSM1596219 and input datasets GSM1596216 and GSM1596220 from study GSE6544141. For Dl, we used ChIP datasets GSM1596223 and GSM1596227 and input
datasets GSM1596224 and GSM1596228 from the same study GSE6544141. For GAF, we used ChIP datasets GSM614652 and input datasets GSM614653 and GSM614654 from study GSE2353743. For wild-type
Bcd, we used ChIP datasets GSM1332670 and GSM1332671 and input datasets GSM1332672 and GSM1332673 from GSE5525640. For Bcd in _zld_ mutants, we used ChIP datasets GSM1332674 and GSM1332675
and input datasets GSM1332676 and GSM1332677 from GSE5525640. Finally, for RNA Pol II, we used ChIP datasets GSM1596231 and GSM1596235 and input datasets GSM1596232 and GSM1596236 from
GSE6544141. GRO-SEQ We mapped the publicly available GRO-seq datasets (GSM1020093 and GSM1020094 from GSE4161147) using STAR74 following the same procedure as used by the ENCODE consortium,
(https://github.com/ENCODE-DCC/long-rna-seq-pipeline/tree/master/dnanexus). CORRELATION ANALYSES BETWEEN THE PS AND CHIP OR GRO-SEQ The correlation analyses75 were performed by first
dividing the genome into 10 kb bins. In each bin, the fraction of sequence occupied by the PS, the respective ChIP or GRO-seq signal was determined. Then, for each bin genome-wide
correlations were calculated between the PS values and a ChIP or GRO-seq signal of interest. The strength of correlation was reported using Spearman correlation coefficients and
corresponding P-values in two flavors, either for a pairwise comparison between two features, or as a part of analyses that examined whether the correlation between two features was affected
by co-correlation with a third feature. The Spearman correlation coefficients were also displayed using a heatmap. Control regions consisted of the randomized PS or the binding profiles for
Zld, Bcd, GAF, and Dl, where each respective feature was chunked into blocks of 200 kb size, that were randomly moved around. CORRELATION BETWEEN THE PS AND ZLD BINDING To visualize the
relationship between PS and Zld binding, we plotted the distribution of PS for genomic bins from each of the four quartiles of the genome-wide distribution of Zld ChIP-seq signal. We then
tested if the effects of Zld binding on chromatin conformation were correlated with the pairing status of loci. We re-analyzed the published Hi-C datasets on Zld depletion33 with the same
computational methods as above and obtained normalized Hi-C maps at 4 kb resolution for WT and Zld-depleted embryos at nuclear cycle 14. Then, we calculated the change of the 20 kb-window
insulation score upon Zld depletion, ΔinsZld, and compared it to PS. For bins from each quartile of Zld ChIP-seq binding, we fitted the resulting 2D-distribution of ΔinsZld vs PS with a
bivariate Gaussian. We then plotted the resulting Gaussians as ellipses corresponding to ±2 standard deviations from the mean along each of the independent axes of the distribution (i.e.
Mahalanobis distance of 2). SETS OF GENES We obtained target gene lists for AP and DV factors from MacArthur et al. (1% FDR dataset)45 and Zeitlinger et al.44. We retrieved locations of
housekeeping genes from the Flybase by selecting genes with at least moderate expression level (RPKM > 11) across all assessed stages and tissues33,46. REPORTING SUMMARY Further
information on research design is available in the Nature Research Reporting Summary linked to this article. DATA AVAILABILITY All raw sequencing data and extracted Hi-C contacts have been
deposited in the Gene Expression Omnibus (GEO) repository under accession number “GSE121255 [https://www.ncbi.nlm.nih.gov/geo/query/acc.cgi?acc=GSE121255]”. The publically available ChIP-seq
and GRO-seq datasets were obtained using accession numbers provided in the Methods section. All other relevant data is available upon request. The source data underlying Fig. 1e and
Supplementary Figs. 2a and 7d are provided as a Source Data file. CODE AVAILABILITY We performed all custom data analyses in Jupyter Notebooks76, using matplotlib77, numpy78, and pandas79
packages. We automated data analyses in command line interface using GNU Parallel80. The software used in this study is available at https://github.com/mirnylab/. REFERENCES * Apte, M. S.
& Meller, V. H. Homologue pairing in flies and mammals: gene regulation when two are involved. _Genet. Res. Int._ 2012, 430587 (2012). PubMed Google Scholar * Joyce, E. F., Erceg, J.
& Wu, C. T. Pairing and anti-pairing: a balancing act in the diploid genome. _Curr. Opin. Genet. Dev._ 37, 119–128 (2016). Article CAS PubMed PubMed Central Google Scholar * Fukaya,
T. & Levine, M. Transvection. _Curr. Biol._ 27, R1047–R1049 (2017). Article CAS PubMed PubMed Central Google Scholar * Cattoni, D. I. et al. Single-cell absolute contact
probability detection reveals chromosomes are organized by multiple low-frequency yet specific interactions. _Nat. Commun._ 8, 1753 (2017). Article ADS PubMed PubMed Central Google
Scholar * Szabo, Q. et al. TADs are 3D structural units of higher-order chromosome organization in Drosophila. _Sci. Adv._ 4, eaar8082 (2018). Article ADS PubMed PubMed Central Google
Scholar * Cardozo Gizzi, A. M. et al. Microscopy-based chromosome conformation capture enables simultaneous visualization of genome organization and transcription in intact organisms. _Mol.
Cell_ 74, 212-222 e5 (2019). Article PubMed Google Scholar * Mateo, L. J. et al. Visualizing DNA folding and RNA in embryos at single-cell resolution. _Nature_ 568, 49–54 (2019). Article
ADS CAS PubMed PubMed Central Google Scholar * Li, Q. et al. The three-dimensional genome organization of Drosophila melanogaster through data integration. _Genome Biol._ 18, 145
(2017). Article PubMed PubMed Central Google Scholar * Viets, K. et al. Homologous chromosomes button together to promote interchromosomal gene regulation. _Dev. Cell_ (2019, In press).
* Jorgensen, R. Altered gene expression in plants due to trans interactions between homologous genes. _Trends Biotechnol._ 8, 340–344 (1990). Article CAS PubMed Google Scholar * Cook, P.
R. The transcriptional basis of chromosome pairing. _J. Cell. Sci._ 110, 1033–1040 (1997). CAS PubMed Google Scholar * Rowley, M. J. et al. Condensin II counteracts cohesin and RNA
polymerase II in the establishment of 3D chromatin organization. _Cell Rep._ 26, 2890–2903 e3 (2019). Article CAS PubMed PubMed Central Google Scholar * Hiraoka, Y. et al. The onset of
homologous chromosome pairing during Drosophila melanogaster embryogenesis. _J. Cell. Biol._ 120, 591–600 (1993). Article CAS PubMed Google Scholar * Fung, J. C., Marshall, W. F.,
Dernburg, A., Agard, D. A. & Sedat, J. W. Homologous chromosome pairing in Drosophila melanogaster proceeds through multiple independent initiations. _J. Cell. Biol._ 141, 5–20 (1998).
Article CAS PubMed PubMed Central Google Scholar * Gemkow, M. J., Verveer, P. J. & Arndt-Jovin, D. J. Homologous association of the Bithorax-Complex during embryogenesis:
consequences for transvection in Drosophila melanogaster. _Development_ 125, 4541–4552 (1998). CAS PubMed Google Scholar * Bateman, J. R. & Wu, C. T. A genomewide survey argues that
every zygotic gene product is dispensable for the initiation of somatic homolog pairing in Drosophila. _Genetics_ 180, 1329–1342 (2008). Article CAS PubMed PubMed Central Google Scholar
* Joyce, E. F., Apostolopoulos, N., Beliveau, B. J. & Wu, C. T. Germline progenitors escape the widespread phenomenon of homolog pairing during Drosophila development. _PLoS Genet._ 9,
e1004013 (2013). Article PubMed PubMed Central Google Scholar * Selvaraj, S., J. R. Dixon, Bansal, V. & Ren, B. Whole-genome haplotype reconstruction using proximity-ligation and
shotgun sequencing. _Nat. Biotechnol_. 31, 1111–1118 (2013). * Rao, S. S. et al. A 3D map of the human genome at kilobase resolution reveals principles of chromatin looping. _Cell_ 159,
1665–1680 (2014). Article CAS PubMed PubMed Central Google Scholar * Deng, X. et al. Bipartite structure of the inactive mouse X chromosome. _Genome Biol._ 16, 152 (2015). Article
PubMed PubMed Central Google Scholar * Dixon, J. R. et al. Chromatin architecture reorganization during stem cell differentiation. _Nature_ 518, 331–336 (2015). Article ADS CAS PubMed
PubMed Central Google Scholar * Minajigi, A. et al. Chromosomes. A comprehensive Xist interactome reveals cohesin repulsion and an RNA-directed chromosome conformation. _Science_ 349,
aab2276 (2015). Article Google Scholar * Darrow, E. M. et al. Deletion of DXZ4 on the human inactive X chromosome alters higher-order genome architecture. _Proc. Natl Acad. Sci. USA_ 113,
E4504–E4512 (2016). Article CAS PubMed PubMed Central Google Scholar * Giorgetti, L. et al. Structural organization of the inactive X chromosome in the mouse. _Nature_ 535, 575–579
(2016). Article ADS CAS PubMed PubMed Central Google Scholar * Du, Z. et al. Allelic reprogramming of 3D chromatin architecture during early mammalian development. _Nature_ 547,
232–235 (2017). Article ADS CAS PubMed Google Scholar * Ke, Y. et al. 3D chromatin structures of mature gametes and structural reprogramming during mammalian embryogenesis. _Cell_ 170,
367–381 e20 (2017). Article CAS PubMed Google Scholar * Barutcu, A. R., Maass, P. G., Lewandowski, J. P., Weiner, C. L. & Rinn, J. L. A TAD boundary is preserved upon deletion of the
CTCF-rich Firre locus. _Nat. Commun._ 9, 1444 (2018). Article ADS PubMed PubMed Central Google Scholar * Bonora, G. et al. Orientation-dependent Dxz4 contacts shape the 3D structure of
the inactive X chromosome. _Nat. Commun._ 9, 1445 (2018). Article ADS CAS PubMed PubMed Central Google Scholar * Tan, L., Xing, D., Chang, C. H., Li, H. & Xie, X. S.
Three-dimensional genome structures of single diploid human cells. _Science_ 361, 924–928 (2018). Article ADS CAS PubMed PubMed Central Google Scholar * Kim, S. et al. The dynamic
three-dimensional organization of the diploid yeast genome. _Elife_ 6, e23623 (2017). * AlHaj Abed, J. et al. Highly structured homolog pairing reflects functional organization of the
_Drosophila_ genome. _Nat. Commun_. (2019, In press). * Harrison, M. M. & Eisen, M. B. Transcriptional activation of the zygotic genome in Drosophila. _Curr. Top. Dev. Biol._ 113, 85–112
(2015). Article CAS PubMed Google Scholar * Hug, C. B., Grimaldi, A. G., Kruse, K. & Vaquerizas, J. M. Chromatin architecture emerges during zygotic genome activation independent of
transcription. _Cell_ 169, 216–228 e19 (2017). Article CAS PubMed Google Scholar * Stadler, M. R., Haines, J. E. & Eisen, M. Convergence of topological domain boundaries,
insulators, and polytene interbands revealed by high-resolution mapping of chromatin contacts in the early Drosophila melanogaster embryo. _Elife_ 6, e29550 (2017). * Dixon, J. R. et al.
Topological domains in mammalian genomes identified by analysis of chromatin interactions. _Nature_ 485, 376–380 (2012). Article ADS CAS PubMed PubMed Central Google Scholar * Nora, E.
P. et al. Spatial partitioning of the regulatory landscape of the X-inactivation centre. _Nature_ 485, 381–385 (2012). Article ADS CAS PubMed PubMed Central Google Scholar * Imakaev,
M. et al. Iterative correction of Hi-C data reveals hallmarks of chromosome organization. _Nat. Methods_ 9, 999–1003 (2012). Article CAS PubMed PubMed Central Google Scholar * Liang, H.
L. et al. The zinc-finger protein Zelda is a key activator of the early zygotic genome in Drosophila. _Nature_ 456, 400–403 (2008). Article ADS CAS PubMed PubMed Central Google Scholar
* Harrison, M. M., Li, X. Y., Kaplan, T., Botchan, M. R. & Eisen, M. B. Zelda binding in the early Drosophila melanogaster embryo marks regions subsequently activated at the
maternal-to-zygotic transition. _PLoS Genet._ 7, e1002266 (2011). Article CAS PubMed PubMed Central Google Scholar * Xu, Z. et al. Impacts of the ubiquitous factor Zelda on
Bicoid-dependent DNA binding and transcription in Drosophila. _Genes Dev._ 28, 608–621 (2014). Article CAS PubMed PubMed Central Google Scholar * Sun, Y. et al. Zelda overcomes the high
intrinsic nucleosome barrier at enhancers during Drosophila zygotic genome activation. _Genome Res._ 25, 1703–1714 (2015). Article CAS PubMed PubMed Central Google Scholar * Chen, K.
et al. A global change in RNA polymerase II pausing during the Drosophila midblastula transition. _eLife_ 2, e00861 (2013). Article PubMed PubMed Central Google Scholar * Negre, N. et
al. A cis-regulatory map of the Drosophila genome. _Nature_ 471, 527–531 (2011). Article ADS CAS PubMed PubMed Central Google Scholar * Zeitlinger, J. et al. Whole-genome ChIP-chip
analysis of Dorsal, Twist, and Snail suggests integration of diverse patterning processes in the Drosophila embryo. _Genes Dev._ 21, 385–390 (2007). Article CAS PubMed PubMed Central
Google Scholar * MacArthur, S. et al. Developmental roles of 21 Drosophila transcription factors are determined by quantitative differences in binding to an overlapping set of thousands of
genomic regions. _Genome Biol._ 10, R80 (2009). Article PubMed PubMed Central Google Scholar * Graveley, B. R. et al. The developmental transcriptome of Drosophila melanogaster. _Nature_
471, 473–479 (2011). Article ADS CAS PubMed Google Scholar * Saunders, A., Core, L. J., Sutcliffe, C., Lis, J. T. & Ashe, H. L. Extensive polymerase pausing during Drosophila axis
patterning enables high-level and pliable transcription. _Genes Dev._ 27, 1146–1158 (2013). Article CAS PubMed PubMed Central Google Scholar * Mayer, W., Smith, A., Fundele, R. &
Haaf, T. Spatial separation of parental genomes in preimplantation mouse embryos. _J. Cell. Biol._ 148, 629–634 (2000). Article CAS PubMed PubMed Central Google Scholar * Flyamer, I. M.
et al. Single-nucleus Hi-C reveals unique chromatin reorganization at oocyte-to-zygote transition. _Nature_ 544, 110–114 (2017). Article ADS CAS PubMed PubMed Central Google Scholar *
Reichmann, J. et al. Dual-spindle formation in zygotes keeps parental genomes apart in early mammalian embryos. _Science_ 361, 189–193 (2018). Article ADS CAS PubMed Google Scholar *
Sexton, T. et al. Three-dimensional folding and functional organization principles of the Drosophila genome. _Cell_ 148, 458–472 (2012). Article CAS PubMed Google Scholar * Lewis, E. B.
The theory and application of a new method of detecting chromosomal rearrangements in Drosophila melanogaster. _Am. Nat._ 88, 225–239 (1954). Article Google Scholar * Davies, J. O.,
Oudelaar, A. M., Higgs, D. R. & Hughes, J. R. How best to identify chromosomal interactions: a comparison of approaches. _Nat. Methods_ 14, 125–134 (2017). Article CAS PubMed Google
Scholar * Fudenberg, G., Abdennur, N., Imakaev, M., Goloborodko, A. & Mirny, L. A. Emerging evidence of chromosome folding by loop extrusion. _Cold Spring Harb. Symp. Quant. Biol._ 82,
45–55 (2017). Article PubMed Google Scholar * Rowley, M. J. et al. Evolutionarily conserved principles predict 3D chromatin organization. _Mol. Cell_ 67, 837–852 e7 (2017). Article CAS
PubMed PubMed Central Google Scholar * Huettner, A. F. Maturation and fertilization of Drosophila melanogaster. _J. Morphol. Physiol._ 39, 249–265 (1924). Article Google Scholar *
Derti, A., Roth, F. P., Church, G. M. & Wu, C. T. Mammalian ultraconserved elements are strongly depleted among segmental duplications and copy number variants. _Nat. Genet._ 38,
1216–1220 (2006). Article CAS PubMed Google Scholar * Strom, A. R. et al. Phase separation drives heterochromatin domain formation. _Nature_ 547, 241–245 (2017). Article ADS CAS
PubMed PubMed Central Google Scholar * Maass, P.G., Barutcu, A.R. & Rinn, J.L. Interchromosomal interactions: a genomic love story of kissing chromosomes. _J. Cell Biol_. 218, 27–38
(2018). * Joyce, E. F., Williams, B. R., Xie, T. & Wu, C. T. Identification of genes that promote or antagonize somatic homolog pairing using a high-throughput FISH-based screen. _PLoS
Genet._ 8, e1002667 (2012). Article CAS PubMed PubMed Central Google Scholar * Beliveau, B. J. et al. Single-molecule super-resolution imaging of chromosomes and in situ haplotype
visualization using Oligopaint FISH probes. _Nat. Commun._ 6, 7147 (2015). Article ADS CAS PubMed Google Scholar * Senaratne, T. N., Joyce, E. F., Nguyen, S. C. & Wu, C. T.
Investigating the interplay between sister chromatid cohesion and homolog pairing in Drosophila nuclei. _PLoS Genet._ 12, e1006169 (2016). Article PubMed PubMed Central Google Scholar *
Beliveau, B. J. et al. In situ super-resolution imaging of genomic DNA with OligoSTORM and OligoDNA-PAINT. _Methods Mol. Biol._ 1663, 231–252 (2017). Article CAS PubMed PubMed Central
Google Scholar * Pedersen, B. S. & Quinlan, A. R. Mosdepth: quick coverage calculation for genomes and exomes. _Bioinformatics_ 34, 867–868 (2018). Article CAS PubMed Google Scholar
* Li, H. & Durbin, R. Fast and accurate short read alignment with Burrows-Wheeler transform. _Bioinformatics_ 25, 1754–1760 (2009). Article CAS PubMed PubMed Central Google Scholar
* Golloshi, R., Sanders, J. T. & McCord, R. P. Iteratively improving Hi-C experiments one step at a time. _Methods_ 142, 47–58 (2018). Article CAS PubMed Google Scholar * Star, B.
et al. Palindromic sequence artifacts generated during next generation sequencing library preparation from historic and ancient DNA. _PLoS. ONE._ 9, e89676 (2014). Article ADS PubMed
PubMed Central Google Scholar * Lajoie, B. R., Dekker, J. & Kaplan, N. The Hitchhiker’s guide to Hi-C analysis: practical guidelines. _Methods_ 72, 65–75 (2015). Article CAS PubMed
Google Scholar * Glenn, T. C. Field guide to next-generation DNA sequencers. _Mol. Ecol. Resour._ 11, 759–769 (2011). Article CAS PubMed Google Scholar * Paten, B., Novak, A. M.,
Eizenga, J. M. & Garrison, E. Genome graphs and the evolution of genome inference. _Genome Res._ 27, 665–676 (2017). Article CAS PubMed PubMed Central Google Scholar * Lilue, J. et
al. Sixteen diverse laboratory mouse reference genomes define strain-specific haplotypes and novel functional loci. _Nat. Genet._ 50, 1574–1583 (2018). Article CAS PubMed PubMed Central
Google Scholar * Landt, S. G. et al. ChIP-seq guidelines and practices of the ENCODE and modENCODE consortia. _Genome Res._ 22, 1813–1831 (2012). Article CAS PubMed PubMed Central
Google Scholar * Quinlan, A. R. & Hall, I. M. BEDTools: a flexible suite of utilities for comparing genomic features. _Bioinformatics_ 26, 841–842 (2010). Article CAS PubMed PubMed
Central Google Scholar * Dobin, A. et al. STAR: ultrafast universal RNA-seq aligner. _Bioinformatics_ 29, 15–21 (2013). Article CAS PubMed Google Scholar * McCole, R. B., Erceg, J.,
Saylor, W. & Wu, C. T. Ultraconserved elements occupy specific arenas of three-dimensional mammalian genome organization. _Cell Rep._ 24, 479–488 (2018). Article CAS PubMed PubMed
Central Google Scholar * Kluyver, T. et al. Jupyter Notebooks—a publishing format for reproducible computational workflows. in _Positioning and Power in Academic Publishing: Players,
Agents and Agendas_ (eds Loizides, F. & Schmidt, B.) 87–90 (IOS Press, 2016). * Hunter, J.D. Matplotlib: A 2D graphics environment. in _Computing in Science & Engineering_ Vol. 9
(eds Thiruvathukal, G.K. & Läufer, K.) 90–95 (IEEE CS and the AIP, 2007). * van der Walt, S., Colbert, S.C. & Varoquaux, G. The NumPy array: a structure for efficient numerical
computation. in _Computing in Science & Engineering_ Vol. 13 22–30 (IEEE CS, 2011). * McKinney, W. Data Structures for Statistical Computing in Python. in _Proceedings of the 9th Python
in Science Conference_(eds van der Walt, S. & Millman, J.) 51–56 (2010). * Tange, O. GNU parallel: the command-line power tool. _USENIX Mag._ 36, 42–47 (2011). Google Scholar Download
references ACKNOWLEDGEMENTS We are grateful to the Wu and Mirny laboratories, participants of the Annual Northeast Regional Chromosome Pairing Conferences, the Lieberman Aiden laboratory,
4DN DCIC, in particular Giancarlo Bonora from the Noble laboratory, Brian J. Beliveau, Guillaume J. Filion, Mirko Francesconi, Ben Lehner, M. Jordan Rowley, and the Cavalli laboratory,
especially Frédéric Bantignies, for discussions, the Furlong laboratory for Oregon-R fly collection, the Rushlow laboratory for _UAS-shRNA-zld_ line, the TUCF Genomics Sequencing Core
Facility, the Microscopy Resources on North Quad (MicRoN), and the Bloomington _Drosophila_ Stock Center for _Drosophila_ stocks. We apologize to the authors whose work we could not cite due
to constrains on referencing. This work was supported by an EMBO Long-Term Fellowship (ALTF 186-2014) to J.E., a William Randolph Hearst Award to R.B.M., and awards from NIH/NCI (Ruth L.
Kirschstein NRSA, F32CA157188) to E.F.J., NIH/NHGRI (R01 HG003143) to J.D. (Howard Hughes Medical Institute investigator), NIH/NIGMS (R01 GM114190) to L.A.M., and NIH/NIGMS (RO1GM123289,
DP1GM106412, R01HD091797) and HMS to C-t.W. J.D., and L.A.M. acknowledge support from the National Institutes of Health Common Fund 4D Nucleome Program (U54 DK107980). AUTHOR INFORMATION
Author notes * Bryan R. Lajoie Present address: Illumina, San Diego, CA, USA * Geoffrey Fudenberg Present address: Gladstone Institutes of Data Science and Biotechnology, San Francisco, CA,
94158, USA * Son C. Nguyen & Eric F. Joyce Present address: Department of Genetics, Penn Epigenetics Institute, Perelman School of Medicine, University of Pennsylvania, Philadelphia, PA,
19104-6145, USA * T. Niroshini Senaratne Present address: Department of Pathology and Laboratory Medicine, David Geffen School of Medicine, University of California, Los Angeles, CA, 90095,
USA * These authors contributed equally: Jelena Erceg, Jumana AlHaj Abed, Anton Goloborodko. AUTHORS AND AFFILIATIONS * Department of Genetics, Harvard Medical School, Boston, MA, 02115,
USA Jelena Erceg, Jumana AlHaj Abed, Ruth B. McCole, Son C. Nguyen, Wren Saylor, Eric F. Joyce, T. Niroshini Senaratne, Mohammed A. Hannan, Guy Nir & C.-ting Wu * Institute for Medical
Engineering and Science, Massachusetts Institute of Technology (MIT), Cambridge, MA, 02139, USA Anton Goloborodko, Geoffrey Fudenberg, Nezar Abdennur, Maxim Imakaev & Leonid A. Mirny *
Howard Hughes Medical Institute and Program in Systems Biology, Department of Biochemistry and Molecular Pharmacology, University of Massachusetts Medical School, Worcester, MA, 01605-0103,
USA Bryan R. Lajoie & Job Dekker * Department of Physics, Massachusetts Institute of Technology (MIT), Cambridge, MA, 02139, USA Leonid A. Mirny * Wyss Institute for Biologically
Inspired Engineering, Harvard University, Boston, MA, 02115, USA C.-ting Wu Authors * Jelena Erceg View author publications You can also search for this author inPubMed Google Scholar *
Jumana AlHaj Abed View author publications You can also search for this author inPubMed Google Scholar * Anton Goloborodko View author publications You can also search for this author
inPubMed Google Scholar * Bryan R. Lajoie View author publications You can also search for this author inPubMed Google Scholar * Geoffrey Fudenberg View author publications You can also
search for this author inPubMed Google Scholar * Nezar Abdennur View author publications You can also search for this author inPubMed Google Scholar * Maxim Imakaev View author publications
You can also search for this author inPubMed Google Scholar * Ruth B. McCole View author publications You can also search for this author inPubMed Google Scholar * Son C. Nguyen View author
publications You can also search for this author inPubMed Google Scholar * Wren Saylor View author publications You can also search for this author inPubMed Google Scholar * Eric F. Joyce
View author publications You can also search for this author inPubMed Google Scholar * T. Niroshini Senaratne View author publications You can also search for this author inPubMed Google
Scholar * Mohammed A. Hannan View author publications You can also search for this author inPubMed Google Scholar * Guy Nir View author publications You can also search for this author
inPubMed Google Scholar * Job Dekker View author publications You can also search for this author inPubMed Google Scholar * Leonid A. Mirny View author publications You can also search for
this author inPubMed Google Scholar * C.-ting Wu View author publications You can also search for this author inPubMed Google Scholar CONTRIBUTIONS J.E., J.A.A., and C-t.W. designed the
experiments. A.G. designed Hi-C computational analyses with input from J.E., J.A.A., L.A.M., and C-t.W. J.D. and B.R.L. provided input in experimental design and data analysis. Experimental
data were generated by J.E. and J.A.A., with the help of S.C.N., E.F.J., T.N.S., M.A.H. for sorting males and virgin females, and G.N. for Oligopaints design. J.E. and R.B.M. selected the
parental lines. J.E., J.A.A., A.G., B.R.L., G.F., N.A., M.I., R.B.M., and W.S. performed computational analyses of the Hi-C data. J.E. performed FISH data analysis and Zld depletion
experiments. J.E., J.A.A., A.G., G.F., L.A.M., and C.-t.W. interpreted the data. J.E., J.A.A., A.G., L.A.M., and C.-t.W. wrote the paper with input from the other authors. CORRESPONDING
AUTHORS Correspondence to Leonid A. Mirny or C.-ting Wu. ETHICS DECLARATIONS COMPETING INTERESTS The authors declare no competing interests. ADDITIONAL INFORMATION PEER REVIEW INFORMATION
_Nature Communications_ thanks the anonymous reviewer(s) for their contribution to the peer review of this work. Peer reviewer reports are available. PUBLISHER’S NOTE Springer Nature remains
neutral with regard to jurisdictional claims in published maps and institutional affiliations. SUPPLEMENTARY INFORMATION SUPPLEMENTARY INFORMATION PEER REVIEW FILE REPORTING SUMMARY
DESCRIPTION OF ADDITIONAL SUPPLEMENTARY FILES SUPPLEMENTARY DATA 1 SOURCE DATA SOURCE DATA RIGHTS AND PERMISSIONS OPEN ACCESS This article is licensed under a Creative Commons Attribution
4.0 International License, which permits use, sharing, adaptation, distribution and reproduction in any medium or format, as long as you give appropriate credit to the original author(s) and
the source, provide a link to the Creative Commons license, and indicate if changes were made. The images or other third party material in this article are included in the article’s
Creative Commons license, unless indicated otherwise in a credit line to the material. If material is not included in the article’s Creative Commons license and your intended use is not
permitted by statutory regulation or exceeds the permitted use, you will need to obtain permission directly from the copyright holder. To view a copy of this license, visit
http://creativecommons.org/licenses/by/4.0/. Reprints and permissions ABOUT THIS ARTICLE CITE THIS ARTICLE Erceg, J., AlHaj Abed, J., Goloborodko, A. _et al._ The genome-wide multi-layered
architecture of chromosome pairing in early _Drosophila_ embryos. _Nat Commun_ 10, 4486 (2019). https://doi.org/10.1038/s41467-019-12211-8 Download citation * Received: 25 January 2019 *
Accepted: 27 August 2019 * Published: 03 October 2019 * DOI: https://doi.org/10.1038/s41467-019-12211-8 SHARE THIS ARTICLE Anyone you share the following link with will be able to read this
content: Get shareable link Sorry, a shareable link is not currently available for this article. Copy to clipboard Provided by the Springer Nature SharedIt content-sharing initiative
Trending News
Tom schwartz reveals whether he’d marry again after katie maloney divorceEXPLORE MORE Tom Schwartz may be off the market — forever. The “Vanderpump Rules” star confessed to Andy Cohen on “Watch...
The love he left behind: all about david bowie and iman's unbreakable bond and how she's 'holding up', says sourceThey were a beautiful, fashionable and staggeringly talented couple, but David Bowie and Iman were even more enviable fo...
Shopping: vs opens 1st pink store; california market center sales_This article was originally on a blog post platform and may be missing photos, graphics or links. See About archive blo...
Don rickles: his most memorable comedic momentsFor over six decades, Don Rickles was a living comedy highlight reel. Whether he was roasting his own audience during a ...
Top 10 schools and educational buildings of 2021WHETHER IT’S A KINDERGARTEN OR A UNIVERSITY CAMPUS, THE SPACES IN WHICH WE LEARN DIRECTLY INFLUENCE HOW KNOWLEDGE IS ABS...
Latests News
The genome-wide multi-layered architecture of chromosome pairing in early drosophila embryosABSTRACT Genome organization involves _cis_ and _trans_ chromosomal interactions, both implicated in gene regulation, de...
Veteran producer tom mcnulty to head the exchange’s new production divisionVeteran producer Tom McNulty, whose credits include _The Spectacular Now _and _Date Night_, has been hired by The Exchan...
We are 'underweight' on indian equities; see risk of earnings downgrades: hsbcAccording to the global brokerage firm, the country has seen a progress of structural reforms across sectors, equities a...
Terry crews recreates white chicks dance for america's got talent audience: 'always ready'Terry Crews has still got the moves! On Tuesday, the 53-year-old actor shared a video of himself on Instagram of a behin...
Nhs workers join anti-vax facebook that claims covid vaccine is 'poison'HUNDREDS of NHS workers have joined an anti-vax Facebook group claiming the coronavirus vaccine is a "poison" ...