Cedad—a novel assay for simultaneous tracking of cell death and division in a single population
Cedad—a novel assay for simultaneous tracking of cell death and division in a single population"
- Select a language for the TTS:
- UK English Female
- UK English Male
- US English Female
- US English Male
- Australian Female
- Australian Male
- Language selected: (auto detect) - EN
Play all audios:
ABSTRACT The cell division cycle and the various forms of programmed cell death are interconnected. A prominent example is the tumor suppressor p53, which not only induces apoptosis but also
plays an important role in the arrest of the cell cycle. Consequently, simultaneous analysis of cell division and cell death is frequently of significant interest in cell biology research.
Traditionally, these processes require distinct assays, making concurrent analysis challenging. To address this, we present a novel combined assay, called _CeDaD_ assay—_Cell Death and
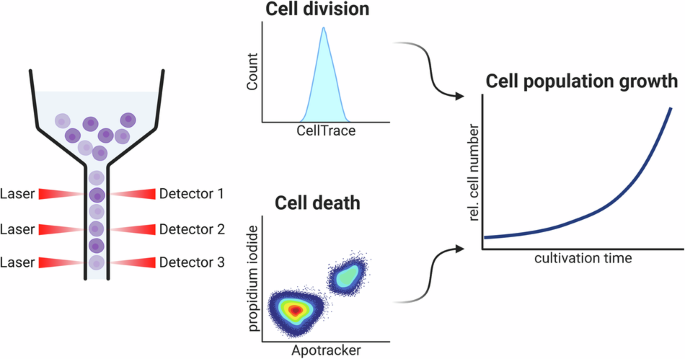
Division_ assay—which allows for the simultaneous quantification of cell division and cell death within a single-cell population. This assay utilizes a straightforward flow cytometric
approach, combining a staining based on carboxyfluorescein succinimidyl ester (CFSE) to monitor cell division with an annexin V-derived staining to assess the extent of cell death. SIMILAR
CONTENT BEING VIEWED BY OTHERS FLOW CYTOMETRIC SINGLE CELL-BASED ASSAY TO SIMULTANEOUSLY DETECT CELL DEATH, CELL CYCLING, DNA CONTENT AND CELL SENESCENCE Article 09 March 2022 COMPREHENSIVE
ANALYSIS OF CELLULAR METRICS: FROM PROLIFERATION TO MITOCHONDRIAL MEMBRANE POTENTIAL AND CELL DEATH IN A SINGLE SAMPLE Article Open access 24 March 2025 THE INTENSITIES OF CANONICAL
SENESCENCE BIOMARKERS INTEGRATE THE DURATION OF CELL-CYCLE WITHDRAWAL Article Open access 27 July 2023 INTRODUCTION In cell biology research, the analysis of various aspects of cellular
physiology—including cell signaling, cell–cell interactions, differentiation, as well as the examination of disease models and the impact of drugs and compounds—is typically conducted using
cell culture models. Two fundamental processes that define the growth dynamics of a cell culture population are cell division and cell death, whose dysfunctional interplay is central to the
development of cancer. Cell division, the outcome of the cell cycle, whereby a single cell divides into two daughter cells, is the primary process driving the expansion of a cell population
and is subject to tight regulatory control [1, 2]. Cell cycle regulation is largely mediated through protein phosphorylation and transcriptional control [3,4,5]. Cell death, in contrast,
contributes to the reduction of a cell population and can be categorized into necrosis and apoptosis, along with various subtypes and intermediate forms such as necroptosis and pyroptosis.
Among these, apoptosis is the primary mechanism responsible for physiological cell death [6,7,8,9]. Cell cycle and apoptosis regulation are intricately linked through multiple signaling
pathways, amongst which those involving the tumor suppressor p53 are particularly prominent. This protein plays a dual role by inducing apoptosis and causing cell cycle arrest through
partially divergent and partially overlapping signaling pathways [10, 11]. A key mechanism by which p53 connects apoptosis induction to cell cycle arrest is through its impact on the RB/E2F
and DREAM/MuvB transcriptional systems through indirect inhibition of cyclin-dependent kinases (CDKs). This p53-DREAM/RB pathway leads to the transcriptional repression of genes encoding
central cell cycle regulators and ultimately causes cell cycle arrest [12,13,14,15,16,17]. Consequently, a loss of RB and the DREAM/MuvB component LIN37 leads to a derepression and
deregulation of cell cycle genes [18]. Given the central role of cell cycle and apoptosis regulation in both cancer prevention and treatment researchers have sought ways to identify
compounds that can effectively target and disrupt these signaling pathways when they malfunction. For example, specific inhibitors have been developed to target the many kinases that control
the cell cycle [4]. Only recently, CDK7 was identified as a critical activator of the main CDKs required for cell cycle control and has therefore become a promising new target for cancer
therapy [19,20,21]. Apart from CDKs, several other kinases are essential for a successful cell division. For instance, polo-like kinase 1 (PLK1) is required for various phases of mitosis
including mitotic entry and spindle formation [22]. Inhibition of PLK1 by volasertib leads to mitotic arrest and is approved for the treatment of acute myeloid leukemia by the FDA [23]. p53
function has also been a major focus of investigation. One approach involves inhibiting the activity of mouse double minute 2 (MDM2), an E3 ubiquitin ligase that facilitates the proteolysis
of p53 [10]. To evaluate the growth rate of a cell population without a detailed insight into cell division activity and cell death rate, numerous assay systems have been developed [24]. The
simplest and most direct method for assessing cell population growth is cell counting, which can be performed either via microscopy or in suspension following trypsinization [25]. However,
both direct cell counting methods are labor-intensive. To address this, automated microscopic cell counting has been recently developed, particularly utilizing deep learning [26,27,28].
Alternatively, several chemical high-throughput assays indirectly measure population growth. For instance, the _ATP_ assay estimates cell population growth based on ATP concentration, while
the tetrazolium salt-based colorimetric _MTT_ and _WST_ assays measure NADH concentration either directly or indirectly [29,30,31]. Although these assays are popular due to their simplicity,
they are susceptible to artifacts that researchers must be aware of, as they only indirectly infer cell population growth based on metabolic markers [32,33,34,35]. In order to obtain
quantitative information about cell cycle activity within a cell population, only a few assays are commonly used in addition to qualitative methods that analyze cell cycle phase
distribution, such as DNA content staining or _Fluorescent Ubiquitination-based Cell Cycle Indicators_ [25]. The most commonly employed assays for quantifying cells undergoing DNA
replication within a defined time window are staining using bromodeoxyuridine (BrdU) and staining with its derivative ethynyldeoxyuridine (EdU). However, these assays are prone to artifacts,
such as endoreduplication without completing the cell cycle, which can occur due to interference with the mitotic machinery [25, 36, 37]. Alternatively, dye dilution assays, like
carboxyfluorescein succinimidyl ester (CFSE) and the second-generation CFSE-derived _CellTrace_ staining, measure cell divisions by tracking dye concentration per cell after a defined
incubation period. During each cytokinesis, the dye in the mother cell is equally distributed between the daughter cells [38,39,40]. These stainings can be quantified using live cell flow
cytometry. Cell death, alongside cell division, is a crucial factor in describing the growth of a cell population. Various assays specialize in detecting cell death through different
mechanisms [41]. For instance, the _TUNEL_ assay visualizes late apoptotic cells undergoing DNA fragmentation, either microscopically or via flow cytometry [42, 43]. Caspase assays identify
apoptotic cells by detecting active caspase forms in immunoassays [44, 45]. More recently, label-free approaches to identify cell death have been explored [46]. Finally, one of the most
commonly used labeling-based methods, annexin V and propidium iodide (PI) double staining, detects apoptotic and dead cells by assessing the loss of membrane integrity and asymmetry [41,
47]. Since traditional annexin V staining relies on calcium binding, a calcium-independent fluorogenic peptide alternative, known commercially as _Apotracker Green_, has been developed to
detect apoptotic cells [48]. To our knowledge, live cell imaging, with or without additional dyes, is the only method available to directly analyze both cell division and cell death within a
single-cell population. However, this approach is often limited by technical complexity, image quality issues, cell motility, and morphological changes [49,50,51,52,53,54]. Consequently,
despite the availability of methods to separately analyze cell cycle activity and cell death, the ability to quantify both processes simultaneously remains highly limited. Here, we present
an easy-to-use flow cytometric assay, named _CeDaD_ assay—_Cell Death and Division_ assay—for simultaneous analysis of cell cycle activity and cell death within a single-cell population.
This novel assay combines two well-established, commercially available assays: the CFSE-based _CellTrace Violet_ assay and annexin V-based _Apotracker Green_ staining with PI. This allows
for rapid assessment of both cell division and cell death in small samples. In addition, simple calculations can generate exponential growth curves. To validate the _CeDaD_ assay, we
analyzed a colorectal carcinoma cell line treated with three compounds targeting p53 and cell cycle pathways—AMG 232 (MDM2 inhibitor), YKL-5-124 (CDK7 inhibitor), and volasertib (PLK1
inhibitor) [23, 55,56,57]. RESULTS AND DISCUSSION CELL COUNT AND _WST_ ASSAY SHOW AN IMPACT OF THREE COMPOUNDS ON CELL POPULATION GROWTH, BUT CANNOT DIFFERENTIATE BETWEEN CELL CYCLE ARREST
AND CELL DEATH INDUCTION As model compounds interfering with cell division and viability, the MDM2 inhibitor AMG 232, the CDK7 inhibitor YKL-5-124, and the PLK1 inhibitor volasertib were
utilized [23, 55, 56, 58,59,60,61]. Although the antiproliferative effects of these compounds are well-documented, their impact on HCT116 cells was validated using _WST_ assay and cell
counting (Fig. 1). Both methods revealed a strong, concentration-dependent reduction in HCT116 cell growth after 48 h of treatment (Fig. 1A–C). Interestingly, while YKL-5-124 produced
consistent results across both assays (Fig. 1B), significant discrepancies were observed in effect sizes for AMG 232 and volasertib between cell counting and _WST_ assays (Fig. 1A, C).
Notably, only direct cell counting allows for the accurate measurement of fold changes in cell number relative to the initial population. Furthermore, prolonged treatment times revealed
additive inhibitory effects, with 10−6 M volasertib causing a reduction in total cell number by day 2. By day 3 and 4, the increased effect size was attributed primarily to enhanced control
growth rather than a drop in the minimum cell number (Fig. 1D). For later evaluation of the _CeDaD_ assay, drug concentrations with significant impact on cell population growth were selected
(Fig. 1E). Our data highlight the limitations of metabolic assays, such as the _WST_ assay, compared to the more direct method of cell counting. While these assays can be valuable
high-throughput tools, their potential artifacts, masked by low standard deviations, must be actively considered. Without such caution, they can create a false sense of accuracy. The
discrepancies observed with AMG 232 and volasertib treatments illustrate this point, emphasizing the need for cross-validation with methods such as cell counting. Consequently, cell counting
was preferred over the _WST_ assay for comparison with the _CeDaD_ assay. CELL DIVISION AND CELL DEATH RATES CAN BE ANALYZED FROM ONE CELL SAMPLE The _CeDaD_ assay combines _CellTrace
Violet_, PI, and _Apotracker Green_ staining, with absorption and emission spectra optimized for simultaneous flow cytometric analysis. This method is designed to track cell division and
cell death events within a single population of less than one million cells. To analyze cell division activity, single cells were gated into categories of no, one, two, three, or four
divisions based on decreasing _CellTrace Violet_ staining after 48 h of incubation. Given the short doubling time of HCT116 cells in the literature (16–29 h) and in our cell counting
experiments (20.9–21.6 h), up to three divisions are likely and even four divisions are possible [62, 63]. Gating is exemplified for DMSO and 10−6 M volasertib-treated cells in Fig. 2A.
Treatment with 10−6 M volasertib significantly reduced populations undergoing two to four divisions while increasing the proportion of cells dividing once or not at all (Fig. 2B). The
equation used to calculate the cell division rate of a population is depicted in Fig. 2C. This equation assesses the theoretical ratio of cell numbers 2 days after and before _CellTrace
Violet_ staining, based on the proportion of cells with different division counts. As one cell produces two daughter cells per cell cycle, it assumes that two cells that were gated into the
one-cell division population derived from one initial mother cell. Accordingly, four cells within the population after two cell divisions and eight cells from the three cell divisions
population each stem from one initial cell. Given that cell division is an exponential process, a logarithm with base two is applied to calculate the average number of divisions per cell
over 2 days. To express this as cell divisions per cell and day, the value is divided by the incubation period in days. For all drug treatments, cell division rates representing the average
number of cell divisions per cell and day were calculated based on the cell division distribution (Fig. 2D). Cell division rates showed a significant decrease across all drug treatment
conditions as measured by the _CeDaD_ assay. However, this calculation only considers cell division when analyzing population growth, without accounting for cell death. In order to assess
the cell death rate within a population, a double staining approach using _Apotracker Green_ and PI, derived from the commonly used annexin V/PI combination, was employed. Figure 2E, F shows
representative analyses after 10−6 M volasertib and DMSO control treatment. After gating single cells, four subgroups were identified: viable cells (_Apotracker_ negative, PI negative),
apoptotic cells (_Apotracker_ positive, PI negative), dead cells (_Apotracker_ positive, PI positive), and a fourth category of artifacts (_Apotracker_ negative, PI positive). This artifact
population likely represents cell fragments or cells that died between _Apotracker Green_ and PI staining as _Apotracker Green_ and similar dyes would be able to enter and stain a dead cell
through the ruptured cell membrane as does PI [47, 64]. This population, therefore, was excluded from further calculations. The cell death rate per day was calculated by relating apoptotic
and dead cells to the total of all cells (viable, apoptotic, and dead cells). The inverse of this rate is the cell viability rate, with the sum of both always equaling one. This calculation
assumes that cells are detectable for approximately 1 day between _Apotracker Green_ detection of apoptosis and cell lysis. Available data, though limited, suggest similar durations [65,
66]. In HCT116 cells, treatment with 10−6.5 M YKL-5-124 and 10−7.5 M to 10−6 M volasertib significantly increased the cell death rate 2 days post-treatment, reducing viability (Fig. 2G). AMG
232, however, did not induce cell death in HCT116 cells. Of note, for dead cells it is not possible to distinguish between cells post apoptosis or necrosis, as annexin V-derived staining
can stain dead cells due to their ruptured cell membrane [47, 64]. Consequently, we do not claim that the _CeDaD_ assay can reliably distinguish between different forms of cell death. For a
closer characterization of the cell death subtypes additional assay systems should be employed. Moreover, to evaluate the cell death rate of a cell population the combination of annexin
V-derived staining and PI staining can theoretically be replaced by any other live/dead staining suitable for flow cytometry using the appropriate filters (green and red) such as a
combination of Calcein AM and ethidium homodimer-1 double staining [67]. The analysis of cell division and cell death rates is a valuable approach to compare the effects of compounds on
different cell lines. In our study, we employed the HCT116 cell model system, which includes cells with deletions in the _LIN37_ and the _RB_ genes, to investigate the impact of volasertib
on cell division and viability [18]. LIN37 is a component of the DREAM transcriptional repressor complex, which, like RB, plays a role in cell cycle-dependent transcription and cell cycle
control. _LIN37_ knockout results in the loss of DREAM repressor function [68]. We compared the cell division rates (Fig. 2H) and cell death rates (Fig. 2I) between wild-type HCT116 and
HCT116 LIN37−/−/RB−/− cells following treatment with volasertib at concentrations of 10−7.5 M and 10−6 M. Notably, both concentrations similarly reduced cell division rates across both cell
lines. However, treatment with 10−6 M volasertib resulted in a significantly lower cell death rate in HCT116 LIN37−/−/RB−/− cells compared to wild-type cells. This suggests that the PLK1
inhibitor volasertib exerts a reduced effect on cell death induction in LIN37/DREAM- and RB-deficient cells compared to wild-type cells. This observation highlights the utility of the
_CeDaD_ assay in providing insights into the mechanisms underlying differential cellular responses to diverse conditions. Without detailed data on the balance between cell cycle arrest and
cell death induction, differences in proliferation patterns might be incorrectly attributed to variations in cell division activity alone. Given that the loss of LIN37 and RB disrupts the
repression of cell cycle genes, leading to their deregulation [18], one may mistakenly conclude, based solely on _WST_ assay data, that disparities in cell cycle arrest were responsible for
the observed differences between the cell lines. Importantly, this differential analysis of cell division and cell death activity was achievable from a single-cell population, starting with
as few as 5 × 10⁵ initial cells, even under conditions that further reduced the cell population. CELL DIVISION AND CELL DEATH RATES ADEQUATELY PREDICT CELL POPULATION GROWTH Since cell
division and cell death are the two key parameters that determine the growth potential of a cell population, they can be used to model an exponential growth curve (Fig. 3A). Generally, a
cell division rate of one results in a doubling of the cell number, while a division rate of two leads to a fourfold increase. Conversely, a cell death rate of 0.5 results in a halving of
the cell number, and a death rate of 0.75 causes a fourfold decrease. For a straightforward calculation of the net change in cell population size due to both cell division and death, it is
crucial that the parameters producing equal effects have the same absolute values but opposite signs—positive for the cell division parameter and negative for the cell death parameter.
Therefore, if a cell division rate of one leads to a doubling of the cell population, then a cell death rate factor of minus one should correspondingly cause the population to reduce to half
its size. To accurately derive the cell death rate factor, the cell viability rate—which serves as the opposing factor to the cell death rate—is used as the logarithmic base two. This
approach ensures that both processes are quantified in a manner that reflects their inverse relationship in influencing cell population dynamics. Importantly, the sum of the cell viability
rate and cell death rate of a cell population is always one, and the cell viability rate is defined as a value between zero and one. Therefore, the result of the logarithm will always be
negative, with smaller viability rates producing larger negative logarithmic values, while the cell division rate remains positive. This approach ensures that both parameters, which generate
opposing effects of equal magnitude, have matching absolute values but opposite signs. When calculating the fold change in cell number within a population over a given number of days, the
exponential growth based on a factor of two is defined by the sum of the cell division rate and the logarithm base two of the cell viability rate, multiplied by the cultivation time in days.
This formulation allows for a coherent integration of both cell division and death dynamics in predicting changes in cell population size. Using the _CeDaD_ assay to calculate the fold
change in cell number 2 days after various test treatments, all treatments resulted in a significant reduction in population growth (Fig. 3B). Notably, this approach allowed us to detect
significant differences between treatments, specifically between 10−6 M AMG 232 and 10−6 M volasertib, demonstrating the assay’s sensitivity in distinguishing the differential effects of
these compounds on cell population dynamics. As discussed earlier, this significant difference is most likely due to the additional cytotoxic effects of volasertib rather than differences in
cell cycle arrest (Fig. 2C, G). To validate whether these calculations accurately reflect the actual cell population growth over the 2-day measurement period, the factors determined by the
_CeDaD_ assay were compared to direct cell counts (Fig. 3C). Although the growth of an unimpaired cell population appears to be slightly underestimated, there were no significant differences
between the calculated population growth from the _CeDaD_ assay and the measured fold change in cell numbers obtained through cell counting under any of the drug treatment conditions. The
differing results observed in the DMSO control suggest that, under conditions of high proliferation and low apoptosis, the _CeDaD_ assay may slightly underestimate the population growth.
This underestimation could be attributed to false positives in the _Apotracker Green_/PI staining. Previous studies have indicated a slight overestimation of cell death by this assay,
potentially due to membrane damage occurring during sample preparation [69, 70]. Obviously, technical artifacts which increase the apoptotic background have a more pronounced effect under
conditions of low cell death, while they have minimal impact in scenarios with high cell death. Overall, these results strongly support the functionality of the _CeDaD_ assay, particularly
for analyzing impaired cell division and induced cell death. THE _CEDAD_ ASSAY ENABLES EXTRAPOLATION OF CELL POPULATION GROWTH The _CeDaD_ assay’s final application involves projecting cell
population growth beyond the initial measurement period, as shown in the growth prognosis (Fig. 3D). Notably, the uncertainty of the prognosis inherently increases with the length of the
projected cultivation time. Although this prognosis mirrors the trends observed in Fig. 3A, comparing these projected values with repeated cell counts can particularly reveal secondary
treatment effects. An illustrative example of this comparison is provided for the 10−6 M volasertib treatment (Fig. 3E). The _CeDaD_ assay prognosis (Fig. 3E, blue line) was compared with
exponential growth regressions derived from cell counts over 4 days post-treatment (Fig. 3E, yellow line), from day 0 to day 2 (Fig. 3E, dark-green line), and from day 2 to day 4 (Fig. 3E,
pink line). When comparing the complete data sets, the regression based on cell counts appears to slightly diverge from the _CeDaD_ assay prognosis. However, when the regression is limited
to the same 2-day period as the _CeDaD_ assay measurements (Fig. 3E, dark-green line), the growth curves align much more closely. Interestingly, the increase in the cell count curve from day
2 to day 4 is significantly lower than both the _CeDaD_ assay curve and the initial 2-day cell count regression, suggesting secondary cytotoxic effects due to prolonged volasertib exposure.
Similar effects were observed following treatments with 10−6 M AMG 232 and 10−6.5 M YKL-5-124, but not with 10−7.5 M volasertib (Supplementary Fig. 1). Importantly, no additional effects
were detected in DMSO control-treated cells, as secondary effects are not expected under unimpaired growth conditions (Supplementary Fig. 1). These drug-specific and concentration-dependent
secondary effects would be challenging to discern solely from cell count data, as distinguishing these trends from random fluctuations can be difficult. The _CeDaD_ assay growth prognosis,
however, allowed us to identify secondary treatment effects that might otherwise have been obscured. CONCLUSION The _CeDaD_ assay is a valuable tool to simultaneously evaluate cell division
activity and cell death induction within a single, small-scale cell culture population with minimal effort. Its ability to generate exponential growth curves for cell populations under
investigation makes it especially beneficial when sample size is limited. Moreover, the _CeDaD_ assay not only elucidates distinct mechanisms constraining population growth but also serves
as a complementary tool to cell counting, enabling the visualization of secondary effects arising from treatments or variations in cultivation conditions. MATERIALS AND METHODS CELL CULTURE
AND CELL COUNT ANALYSIS Human colorectal carcinoma HCT116 wild-type (wt) cells (provided by Bert Vogelstein) and HCT116 LIN37−/−/RB−/− cells were cultivated in Dulbecco’s modified Eagle’s
medium (DMEM; Capricorn scientific). A detailed description of the HCT116 LIN37−/−/RB−/− cell line was published earlier [18]. For standard growth medium, DMEM was supplemented with 5% fetal
calf serum (FBS Good; PAN Biotech), 5% serum substitute (Panexin NTA, PAN Biotech), and 1% penicillin/streptomycin (PAN Biotech). All cell lines were cultivated under standard growth
conditions with 37 °C and 10% CO2. For all treatment analyses aside from _WST_ assay 5 × 10⁵ cells were seeded in 2 ml standard growth medium in six-well plates. One day after seeding, 500
µL standard growth medium containing 5x concentrated DMSO (1:200) with or without dissolved compounds, namely AMG 232 (MedChemExpress, HY-12296), YKL-5-124 (MedChemExpress, HY-101257), and
volasertib (MedChemExpress, HY-12137) of varying concentrations was added. Cells cultured without compounds were split and reseeded on day 2 after the start of treatment. Again, 5 × 10⁵
cells were seeded in 2 ml standard growth medium in six-well plates, and the splitting factor was considered for calculations. The growth medium containing DMSO with compounds was changed
after 2 days of incubation. For cell count analysis, cells were trypsinized, stained with trypan blue, and collected in a defined volume of standard growth medium and counted twice with the
Countstar BioTech module (Countstar). PCR-based tests for mycoplasma contamination were performed using the Mycoplasma PCR Detection Kit (Applied Biological Materials). CELL DEATH AND
DIVISION ASSAY For combined analysis of cell division and cell death via flow cytometry, cells were washed once with PBS and stained with 5 µM _CellTrace Violet_ (Thermo Fisher) in 1 ml PBS
based on a 6.6 mM _CellTrace Violet_ solution in DMSO for 30 min. Then, the staining solution was removed and replaced by 2 ml standard growth medium with DMSO (1:1000) with or without
dissolved compounds. Cells were treated with different compounds for 48 h. For staining of apoptotic and dead cells, the supernatant of the cell culture was collected, cells were
trypsinized, added to the supernatant, and centrifuged at 500 × _g_ for 5 min. An equal number of cells were resuspended in PBS containing 400 nM _Apotracker Green_ (Biolegend), incubated
for 30 min, and washed once with PBS. Before flow cytometry, PI (Sigma-Aldrich) was added to a final concentration of 0.1 ng/µl. Combined live cell staining of _CellTrace Violet_ (laser: 405
nm, filter: 450/40 nm), PI (laser: 561 nm, filter: 585/15 nm), and _Apotracker Green_ (laser: 488 nm, filter: 530/30 nm, mirror: 505 nm low pass) was analyzed by flow cytometry (LSRFortessa
Cell Analyzer, Becton Dickinson). 10,000 events were recorded, and FlowJo Version 10 (Becton Dickinson) was used for data analysis. Single cells were gated from the whole cell population
based on forward and side scatter analysis. _WST_ ASSAY For the _WST-1_ assay (Abcam), HCT116 cells were seeded in 96-well plates with 5 × 10³ cells per well in 80 µl standard growth medium.
After 1 day, 20 µl of a 5× concentrated compound solution was added to each well containing DMSO for a final dilution of 1:1000. Two days after treatment, the _WST-1_ assay was performed
according to the manufacturer’s protocol. Specific absorption was measured at _λ_ = 450 nm and as a reference at _λ_ = 620 nm. As a blank value 100 µl standard growth medium with 10 µl
_WST-1_ reagent was used. A detailed list of all used reagents and tools can be found in Supplementary File 1. DATA AVAILABILITY Original data are available upon request. REFERENCES * Evan
GI, Vousden KH. Proliferation, cell cycle and apoptosis in cancer. Nature. 2001;411:342–8. https://doi.org/10.1038/35077213. Article PubMed CAS Google Scholar * Heim A, Rymarczyk B,
Mayer TU. Regulation of cell division. Adv Exp Med Biol. 2017;953:83–116. https://doi.org/10.1007/978-3-319-46095-6_3. Article PubMed CAS Google Scholar * Hatakeyama M, Weinberg RA. The
role of RB in cell cycle control. Prog Cell Cycle Res. 1995;1:9–19. https://doi.org/10.1007/978-1-4615-1809-9_2. Article PubMed CAS Google Scholar * Sherr CJ. Cancer cell cycles.
Science. 1996;274:1672–7. https://doi.org/10.1126/science.274.5293.1672. Article PubMed CAS Google Scholar * Hochegger H, Takeda S, Hunt T. Cyclin-dependent kinases and cell-cycle
transitions. Does one fit all? Nat Rev Mol Cell Biol. 2008;9:910–6. https://doi.org/10.1038/nrm2510. Article PubMed CAS Google Scholar * Elmore S. Apoptosis. A review of programmed cell
death. Toxicol Pathol. 2007;35:495–516. https://doi.org/10.1080/01926230701320337. Article PubMed PubMed Central CAS Google Scholar * Bertheloot D, Latz E, Franklin BS. Necroptosis,
pyroptosis and apoptosis. An intricate game of cell death. Cell Mol Immunol. 2021;18:1106–21. https://doi.org/10.1038/s41423-020-00630-3. Article PubMed PubMed Central CAS Google Scholar
* Park W, Wei S, Kim B-S, Kim B, Bae S-J, Chae YC, et al. Diversity and complexity of cell death. A historical review. Exp Mol Med. 2023;55:1573–94.
https://doi.org/10.1038/s12276-023-01078-x. Article PubMed PubMed Central CAS Google Scholar * Vitale I, Pietrocola F, Guilbaud E, Aaronson SA, Abrams JM, Adam D, et al. Apoptotic cell
death in disease—current understanding of the NCCD 2023. Cell Death Differ. 2023;30:1097–154. https://doi.org/10.1038/s41418-023-01153-w. Article PubMed PubMed Central Google Scholar *
Levine AJ. p53, the cellular gatekeeper for growth and division. Cell. 1997;88:323–31. https://doi.org/10.1016/s0092-8674(00)81871-1. Article PubMed CAS Google Scholar * Chen J. The
cell-cycle arrest and apoptotic functions of p53 in tumor initiation and progression. Cold Spring Harb Perspect Med. 2016;6:a026104. https://doi.org/10.1101/cshperspect.a026104. Article
PubMed PubMed Central CAS Google Scholar * Litovchick L, Sadasivam S, Florens L, Zhu X, Swanson SK, Velmurugan S, et al. Evolutionarily conserved multisubunit RBL2/p130 and E2F4 protein
complex represses human cell cycle-dependent genes in quiescence. Mol Cell. 2007;26:539–51. https://doi.org/10.1016/j.molcel.2007.04.015. Article PubMed CAS Google Scholar * Mannefeld M,
Klassen E, Gaubatz S. B-MYB is required for recovery from the DNA damage-induced G2 checkpoint in p53 mutant cells. Cancer Res. 2009;69:4073–80.
https://doi.org/10.1158/0008-5472.CAN-08-4156. Article PubMed CAS Google Scholar * Sadasivam S, DeCaprio JA. The DREAM complex. Master coordinator of cell cycle-dependent gene
expression. Nat Rev Cancer. 2013;13:585–95. https://doi.org/10.1038/nrc3556. Article PubMed PubMed Central CAS Google Scholar * Fischer M, Quaas M, Steiner L, Engeland K. The
p53-p21-DREAM-CDE/CHR pathway regulates G2/M cell cycle genes. Nucleic Acids Res. 2016;44:164–74. https://doi.org/10.1093/nar/gkv927. Article PubMed CAS Google Scholar * Engeland K. Cell
cycle arrest through indirect transcriptional repression by p53. I have a DREAM. Cell Death Differ. 2018;25:114–32. https://doi.org/10.1038/cdd.2017.172. Article PubMed CAS Google
Scholar * Engeland K. Cell cycle regulation. P53-p21-RB signaling. Cell Death Differ. 2022;29:946–60. https://doi.org/10.1038/s41418-022-00988-z. Article PubMed PubMed Central CAS
Google Scholar * Uxa S, Bernhart SH, Mages CFS, Fischer M, Kohler R, Hoffmann S, et al. DREAM and RB cooperate to induce gene repression and cell-cycle arrest in response to p53 activation.
Nucleic Acids Res. 2019;47:9087–103. https://doi.org/10.1093/nar/gkz635. Article PubMed PubMed Central CAS Google Scholar * Schachter MM, Fisher RP. The CDK-activating kinase Cdk7.
Taking yes for an answer. Cell Cycle. 2013;12:3239–40. https://doi.org/10.4161/cc.26355. Article PubMed PubMed Central CAS Google Scholar * Schachter MM, Merrick KA, Larochelle S,
Hirschi A, Zhang C, Shokat KM, et al. A Cdk7-Cdk4 T-loop phosphorylation cascade promotes G1 progression. Mol Cell. 2013;50:250–60. https://doi.org/10.1016/j.molcel.2013.04.003. Article
PubMed PubMed Central CAS Google Scholar * Song X, Fang C, Dai Y, Sun Y, Qiu C, Lin X, et al. Cyclin-dependent kinase 7 (CDK7) inhibitors as a novel therapeutic strategy for different
molecular types of breast cancer. Br J Cancer. 2024;130:1239–48. https://doi.org/10.1038/s41416-024-02589-8. Article PubMed PubMed Central CAS Google Scholar * Iliaki S, Beyaert R,
Afonina IS. Polo-like kinase 1 (PLK1) signaling in cancer and beyond. Biochem Pharmacol. 2021;193:114747. https://doi.org/10.1016/j.bcp.2021.114747. Article PubMed CAS Google Scholar *
Zhang J, Zhang L, Wang J, Ouyang L, Wang Y. Polo-like kinase 1 inhibitors in human cancer therapy. Development and therapeutic potential. J Med Chem. 2022;65:10133–60.
https://doi.org/10.1021/acs.jmedchem.2c00614. Article PubMed CAS Google Scholar * Butler M, Spearman M, Braasch K. Monitoring cell growth, viability, and apoptosis. Methods Mol Biol.
2014;1104:169–92. https://doi.org/10.1007/978-1-62703-733-4_12. Article PubMed Google Scholar * Eastman A E, Guo S. The palette of techniques for cell cycle analysis. FEBS Lett. 2020.
https://doi.org/10.1002/1873-3468.13842. * Tahara H, Matsuda S, Yamamoto Y, Yoshizawa H, Fujita M, Katsuoka Y, et al. High-content image analysis (HCIA) assay has the highest correlation
with direct counting cell suspension compared to the ATP, WST-8 and Alamar blue assays for measurement of cytotoxicity. J Pharmacol Toxicol Methods. 2017;88:92–9.
https://doi.org/10.1016/j.vascn.2017.08.003. Article PubMed CAS Google Scholar * Verduijn J, van der Meeren L, Krysko DV, Skirtach AG. Deep learning with digital holographic microscopy
discriminates apoptosis and necroptosis. Cell Death Discov. 2021;7:229. https://doi.org/10.1038/s41420-021-00616-8. Article PubMed PubMed Central CAS Google Scholar * Zheng Z, Sun B, He
S, Wang G, Bi C, Chen T. Unsupervised deep learning of bright-field images for apoptotic cell classification. Signal Image Video Process. 2023;17:3657–64.
https://doi.org/10.1007/s11760-023-02592-1. Article Google Scholar * Ngamwongsatit P, Banada PP, Panbangred W, Bhunia AK. WST-1-based cell cytotoxicity assay as a substitute for MTT-based
assay for rapid detection of toxigenic Bacillus species using CHO cell line. J Microbiol Methods. 2008;73:211–5. https://doi.org/10.1016/j.mimet.2008.03.002. Article PubMed CAS Google
Scholar * Glaysher S, Cree IA. Cell sensitivity assays. The ATP-based tumor chemosensitivity assay. Methods Mol Biol. 2011;731:247–57. https://doi.org/10.1007/978-1-61779-080-5_21. Article
PubMed CAS Google Scholar * Präbst K, Engelhardt H, Ringgeler S, Hübner H. Basic colorimetric proliferation assays. MTT, WST, and resazurin. Methods Mol Biol. 2017;1601:1–17.
https://doi.org/10.1007/978-1-4939-6960-9_1. Article PubMed CAS Google Scholar * Stepanenko AA, Dmitrenko VV. Pitfalls of the MTT assay. Direct and off-target effects of inhibitors can
result in over/underestimation of cell viability. Gene. 2015;574:193–203. https://doi.org/10.1016/j.gene.2015.08.009. Article PubMed CAS Google Scholar * Scarcello E, Lambremont A,
Vanbever R, Jacques PJ, Lison D. Mind your assays. Misleading cytotoxicity with the WST-1 assay in the presence of manganese. PLoS ONE. 2020;15:e0231634.
https://doi.org/10.1371/journal.pone.0231634. Article PubMed PubMed Central CAS Google Scholar * Kamiloglu S, Sari G, Ozdal T, Capanoglu E. Guidelines for cell viability assays. Food
Front. 2020;1:332–49. https://doi.org/10.1002/fft2.44. Article Google Scholar * Larsson P, Engqvist H, Biermann J, Werner Rönnerman E, Forssell-Aronsson E, Kovács A, et al. Optimization of
cell viability assays to improve replicability and reproducibility of cancer drug sensitivity screens. Sci Rep. 2020;10:5798. https://doi.org/10.1038/s41598-020-62848-5. Article PubMed
PubMed Central CAS Google Scholar * Shu Z, Row S, Deng W-M. Endoreplication. The good, the bad, and the ugly. Trends Cell Biol. 2018;28:465–74. https://doi.org/10.1016/j.tcb.2018.02.006.
Article PubMed PubMed Central CAS Google Scholar * Kohler R, Engeland K. A-MYB substitutes for B-MYB in activating cell cycle genes and in stimulating proliferation. Nucleic Acids Res.
2024;52:6830–49. https://doi.org/10.1093/nar/gkae370. Article PubMed PubMed Central CAS Google Scholar * Lyons AB, Blake SJ, Doherty KV. Flow cytometric analysis of cell division by
dilution of CFSE and related dyes. Curr Protoc Cytom. 2013;9:9.11.1–12. https://doi.org/10.1002/0471142956.cy0911s64. Article Google Scholar * Altea-Manzano P, Unciti-Broceta JD,
Cano-Cortes V, Ruiz-Blas MP, Valero-Griñan T, Diaz-Mochon JJ, et al. Tracking cell proliferation using a nanotechnology-based approach. Nanomedicine. 2017;12:1591–605.
https://doi.org/10.2217/nnm-2017-0118. Article PubMed CAS Google Scholar * Pereira TF, Levin G, DeOcesano-Pereira C, Caodaglio AS, Fujita A, Tonso A, et al. Fluorescence-based method is
more accurate than counting-based methods for plotting growth curves of adherent cells. BMC Res Notes. 2020;13:57. https://doi.org/10.1186/s13104-020-4914-8. Article PubMed PubMed Central
Google Scholar * Kabakov AE, Gabai VL. Cell Death and survival assays. Methods Mol Biol. 2018;1709:107–27. https://doi.org/10.1007/978-1-4939-7477-1_9. Article PubMed CAS Google
Scholar * Collins JA, Schandi CA, Young KK, Vesely J, Willingham MC. Major DNA fragmentation is a late event in apoptosis. J Histochem Cytochem. 1997;45:923–34.
https://doi.org/10.1177/002215549704500702. Article PubMed CAS Google Scholar * Crowley LC, Marfell BJ, Waterhouse NJ. Detection of DNA fragmentation in apoptotic cells by TUNEL. Cold
Spring Harb Protoc. 2016. https://doi.org/10.1101/pdb.prot087221. * Patil AA, Bhor SA, Rhee WJ. Cell death in culture. Molecular mechanisms, detections, and inhibition strategies. J Ind Eng
Chem. 2020;91:37–53. https://doi.org/10.1016/j.jiec.2020.08.009. Article CAS Google Scholar * Kari S, Subramanian K, Altomonte IA, Murugesan A, Yli-Harja O, Kandhavelu M. Programmed cell
death detection methods. A systematic review and a categorical comparison. Apoptosis. 2022;27:482–508. https://doi.org/10.1007/s10495-022-01735-y. Article PubMed PubMed Central Google
Scholar * Hu C, He S, Lee YJ, He Y, Kong EM, Li H, et al. Live-dead assay on unlabeled cells using phase imaging with computational specificity. Nat Commun. 2022;13:713.
https://doi.org/10.1038/s41467-022-28214-x. Article PubMed PubMed Central CAS Google Scholar * van Engeland M, Nieland LJW, Ramaekers FCS, Schutte B, Reutelingsperger CPM. Annexin
V-Affinity assay. A review on an apoptosis detection system based on phosphatidylserine exposure. Cytometry. 1998;31:1–9. Article PubMed Google Scholar * Barth ND, Subiros-Funosas R,
Mendive-Tapia L, Duffin R, Shields MA, Cartwright JA, et al. A fluorogenic cyclic peptide for imaging and quantification of drug-induced apoptosis. Nat Commun. 2020;11:4027.
https://doi.org/10.1038/s41467-020-17772-7. Article PubMed PubMed Central CAS Google Scholar * Youssef S, Gude S, Rädler JO. Automated tracking in live-cell time-lapse movies. Integr
Biol. 2011;3:1095–101. https://doi.org/10.1039/C1IB00035G. Article Google Scholar * Kurokawa H, Noda H, Sugiyama M, Sakaue-Sawano A, Fukami K, Miyawaki A. Software for precise tracking of
cell proliferation. Biochem Biophys Res Commun. 2012;417:1080–5. https://doi.org/10.1016/j.bbrc.2011.12.100. Article PubMed CAS Google Scholar * Ulman V, Maška M, Magnusson KEG,
Ronneberger O, Haubold C, Harder N, et al. An objective comparison of cell-tracking algorithms. Nat Methods. 2017;14:1141–52. https://doi.org/10.1038/nmeth.4473. Article PubMed PubMed
Central CAS Google Scholar * Emami N, Sedaei Z, Ferdousi R. Computerized cell tracking. Current methods, tools and challenges. Vis Inform. 2021;5:1–13.
https://doi.org/10.1016/j.visinf.2020.11.003. Article Google Scholar * Ahmad S, Wood KC, Scott JE. A high throughput proliferation and cytotoxicity assay for co-cultured isogenic cell
lines. MethodsX. 2022;9:101927. https://doi.org/10.1016/j.mex.2022.101927. Article PubMed PubMed Central CAS Google Scholar * Aspert T, Hentsch D, Charvin G. DetecDiv, a generalist
deep-learning platform for automated cell division tracking and survival analysis. eLife. 2022;11:e79519. https://doi.org/10.7554/eLife.79519. Article PubMed PubMed Central CAS Google
Scholar * Rew Y, Sun D. Discovery of a small molecule MDM2 inhibitor (AMG 232) for treating cancer. J Med Chem. 2014;57:6332–41. https://doi.org/10.1021/jm500627s. Article PubMed CAS
Google Scholar * Olson CM, Liang Y, Leggett A, Park WD, Li L, Mills CE, et al. Development of a selective CDK7 covalent inhibitor reveals predominant cell-cycle phenotype. Cell Chem Biol.
2019;26:792–.e10. https://doi.org/10.1016/j.chembiol.2019.02.012. Article PubMed PubMed Central CAS Google Scholar * Gluck WL, Gounder MM, Frank R, Eskens F, Blay JY, Cassier PA, et al.
Phase 1 study of the MDM2 inhibitor AMG 232 in patients with advanced P53 wild-type solid tumors or multiple myeloma. Investig N Drugs. 2020;38:831–43.
https://doi.org/10.1007/s10637-019-00840-1. Article CAS Google Scholar * Canon J, Osgood T, Olson SH, Saiki AY, Robertson R, Yu D, et al. The MDM2 inhibitor AMG 232 demonstrates robust
antitumor efficacy and potentiates the activity of p53-inducing cytotoxic agents. Mol Cancer Ther. 2015;14:649–58. https://doi.org/10.1158/1535-7163.MCT-14-0710. Article PubMed CAS Google
Scholar * Konopleva M, Martinelli G, Daver N, Papayannidis C, Wei A, Higgins B, et al. MDM2 inhibition. An important step forward in cancer therapy. Leukemia. 2020;34:2858–74.
https://doi.org/10.1038/s41375-020-0949-z. Article PubMed Google Scholar * Funke K, Düster R, Wilson PD-G, Arévalo L, Geyer M, Schorle H. Transcriptional CDK inhibitors as potential
treatment option for testicular germ cell tumors. Cancers. 2022;14:1690. https://doi.org/10.3390/cancers14071690. Article PubMed PubMed Central CAS Google Scholar * Su S, Chhabra G,
Singh CK, Ndiaye MA, Ahmad N. PLK1 inhibition-based combination therapies for cancer management. Transl Oncol. 2022;16:101332. https://doi.org/10.1016/j.tranon.2021.101332. Article PubMed
CAS Google Scholar * Yao K, Gietema JA, Shida S, Selvakumaran M, Fonrose X, Haas NB, et al. In vitro hypoxia-conditioned colon cancer cell lines derived from HCT116 and HT29 exhibit
altered apoptosis susceptibility and a more angiogenic profile in vivo. Br J Cancer. 2005;93:1356–63. https://doi.org/10.1038/sj.bjc.6602864. Article PubMed PubMed Central CAS Google
Scholar * Samad MA, Saiman MZ, Abdul Majid N, Karsani SA, Yaacob JS. Berberine inhibits telomerase activity and induces cell cycle arrest and telomere erosion in colorectal cancer cell
line, HCT 116. Molecules. 2021;26:376. https://doi.org/10.3390/molecules26020376. Article PubMed PubMed Central CAS Google Scholar * Balvan J, Krizova A, Gumulec J, Raudenska M, Sladek
Z, Sedlackova M, et al. Multimodal holographic microscopy. Distinction between apoptosis and oncosis. PLoS ONE. 2015;10:e0121674. https://doi.org/10.1371/journal.pone.0121674. Article
PubMed PubMed Central CAS Google Scholar * Blanco-Andujar C, Ortega D, Southern P, Nesbitt SA, Thanh NTK, Pankhurst QA. Real-time tracking of delayed-onset cellular apoptosis induced by
intracellular magnetic hyperthermia. Nanomedicine. 2016;11:121–36. https://doi.org/10.2217/nnm.15.185. Article PubMed CAS Google Scholar * Kroll P, Eilers K, Fricke J, Herwig C. Impact
of cell lysis on the description of cell growth and death in cell culture. Eng Life Sci. 2017;17:440–7. https://doi.org/10.1002/elsc.201600088. Article PubMed CAS Google Scholar *
Papadopoulos NG, Dedoussis GV, Spanakos G, Gritzapis AD, Baxevanis CN, Papamichail M. An improved fluorescence assay for the determination of lymphocyte-mediated cytotoxicity using flow
cytometry. J Immunol Methods. 1994;177:101–11. https://doi.org/10.1016/0022-1759(94)90147-3. Article PubMed CAS Google Scholar * Mages CF, Wintsche A, Bernhart SH, Müller GA. The DREAM
complex through its subunit Lin37 cooperates with Rb to initiate quiescence. eLife. 2017;6:e26876. https://doi.org/10.7554/eLife.26876. Article PubMed PubMed Central Google Scholar *
Groves MJ, Maccallum S, Boylan MT, Coates PJ, Tauro S. The annexin-V assay reflects susceptibility to in vitro membrane damage in chronic lymphocytic leukemia and may overestimate cell
death. Am J Hematol. 2009;84:196–7. https://doi.org/10.1002/ajh.21347. Article PubMed Google Scholar * Rieger AM, Hall BE, Le Luong T, Schang LM, Barreda DR:. Conventional apoptosis
assays using propidium iodide generate a significant number of false positives that prevent accurate assessment of cell death. J Immunol Methods. 2010;358:81–92.
https://doi.org/10.1016/j.jim.2010.03.019. Article PubMed CAS Google Scholar Download references ACKNOWLEDGEMENTS The authors are grateful to Anna Kohler and Christine E. Engeland for
their critical review of the manuscript and their valuable feedback. We also extend our thanks to Bert Vogelstein for providing the HCT116 cells. Flow cytometry analyses were performed at
the IZKF Leipzig Fluorescence Technologies Core Unit. This research was supported by grants from the _Deutsche Forschungsgemeinschaft (DFG, German Research Foundation)_ under project number
424870812 (awarded to KE) and by the _Roland-Ernst-Stiftung_ (project number 04/22; awarded to KE). FUNDING Open Access funding enabled and organized by Projekt DEAL. AUTHOR INFORMATION
Author notes * These authors contributed equally: Lukas Nöltner, Robin Kohler. AUTHORS AND AFFILIATIONS * Molecular Oncology, Faculty of Medicine, University of Leipzig, Leipzig, Germany
Lukas Nöltner, Kurt Engeland & Robin Kohler Authors * Lukas Nöltner View author publications You can also search for this author inPubMed Google Scholar * Kurt Engeland View author
publications You can also search for this author inPubMed Google Scholar * Robin Kohler View author publications You can also search for this author inPubMed Google Scholar CONTRIBUTIONS
Conceived and designed experiments: RK. Performed the experiments: LN and RK. Analyzed the data: RK. Wrote the paper: LN, RK, and KE. Acquire funding: KE. CORRESPONDING AUTHOR Correspondence
to Robin Kohler. ETHICS DECLARATIONS COMPETING INTERESTS The authors declare no competing interests. ETHICS APPROVAL All methods were performed in accordance with the relevant guidelines
and regulations. The experiments did not require ethical approval, as no studies on animals or human participants were carried out. ADDITIONAL INFORMATION PUBLISHER’S NOTE Springer Nature
remains neutral with regard to jurisdictional claims in published maps and institutional affiliations. SUPPLEMENTARY INFORMATION SUPPLEMENTAL FILE 1 SUPPLEMENTAL FIGURE 1 RIGHTS AND
PERMISSIONS OPEN ACCESS This article is licensed under a Creative Commons Attribution 4.0 International License, which permits use, sharing, adaptation, distribution and reproduction in any
medium or format, as long as you give appropriate credit to the original author(s) and the source, provide a link to the Creative Commons licence, and indicate if changes were made. The
images or other third party material in this article are included in the article’s Creative Commons licence, unless indicated otherwise in a credit line to the material. If material is not
included in the article’s Creative Commons licence and your intended use is not permitted by statutory regulation or exceeds the permitted use, you will need to obtain permission directly
from the copyright holder. To view a copy of this licence, visit http://creativecommons.org/licenses/by/4.0/. Reprints and permissions ABOUT THIS ARTICLE CITE THIS ARTICLE Nöltner, L.,
Engeland, K. & Kohler, R. CeDaD—a novel assay for simultaneous tracking of cell death and division in a single population. _Cell Death Discov._ 11, 86 (2025).
https://doi.org/10.1038/s41420-025-02370-7 Download citation * Received: 30 October 2024 * Revised: 21 January 2025 * Accepted: 20 February 2025 * Published: 04 March 2025 * DOI:
https://doi.org/10.1038/s41420-025-02370-7 SHARE THIS ARTICLE Anyone you share the following link with will be able to read this content: Get shareable link Sorry, a shareable link is not
currently available for this article. Copy to clipboard Provided by the Springer Nature SharedIt content-sharing initiative
Trending News
Real madrid will call tottenham boss mauricio pochettino - balagueZidane resigned as head coach of Real Madrid just days after leading the Spanish club to a third straight Champions Leag...
Were team gb’s skeleton suits responsible for fantastic three medal haul?Team GB skeleton rider Lizzie Yarnold won a stunning Winter Olympic gold on February 17, backed up by bronzes for Laura ...
Ski stations in pyrénées close early due to lack of snowMAJOR RESORT SHUT DOORS TWO WEEKS EARLY AS RAIN AND STORMS MADE IT TOO DANGEROUS TO SKI A ski station in the Pyrénées ha...
Certificates programs can boost your career and skillsDerrick Lewis has new appreciation for something a coworker told him 20 years ago: “You have to keep learning.” That adv...
Comment: weeds can make a garden cheaper and more manageable in franceCOLUMNIST SAMANTHA DAVID TELLS HOW EMBRACING NATURE HAS HIDDEN BENEFITS The day after I moved into my French farmhouse, ...
Latests News
Cedad—a novel assay for simultaneous tracking of cell death and division in a single populationABSTRACT The cell division cycle and the various forms of programmed cell death are interconnected. A prominent example ...
Sbi atm withdrawal rule: want to withdraw more than rs 10,000? You need to enter otpCurated By : Last Updated:July 28, 2022, 10:48 IST A CUSTOMER HAS TO ENTER AN OTP RECEIVED ON THE REGISTERED MOBILE NUMB...
Kate middleton and william skip protocol in 'breakthrough' videoKate Middleton and Prince William shared the short clip on their Instagram page. It was a montage of recent outings of t...
3 injured after fight breaks out among 20 men in otay mesa jailThree detainees at the George Bailey Detention Facility in Otay Mesa were hospitalized Sunday from a fight that broke ou...
London’s cazoo drives forward european expansion as it acquires barcelona-based car subscription marketplace swipcar | eu-startupsFounded in the UK in 2018, Cazoo is one of Europe’s leading car retailers and has today announced that they have acquire...