Resistance and resilience of the forest soil microbiome to logging-associated compaction
Resistance and resilience of the forest soil microbiome to logging-associated compaction"
- Select a language for the TTS:
- UK English Female
- UK English Male
- US English Female
- US English Male
- Australian Female
- Australian Male
- Language selected: (auto detect) - EN
Play all audios:
Soil compaction is a major disturbance associated with logging, but we lack a fundamental understanding of how this affects the soil microbiome. We assessed the structural resistance and
resilience of the microbiome using a high-throughput pyrosequencing approach in differently compacted soils at two forest sites and correlated these findings with changes in soil physical
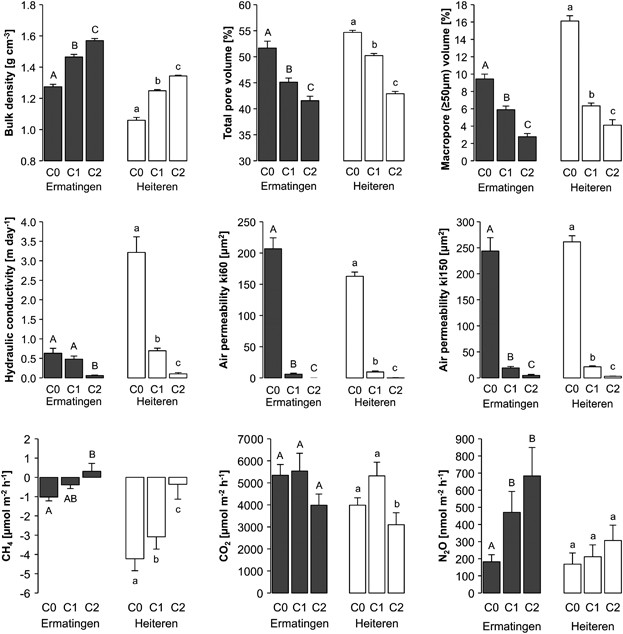
properties and functions. Alterations in soil porosity after compaction strongly limited the air and water conductivity. Compaction significantly reduced abundance, increased diversity, and
persistently altered the structure of the microbiota. Fungi were less resistant and resilient than bacteria; clayey soils were less resistant and resilient than sandy soils. The strongest
effects were observed in soils with unfavorable moisture conditions, where air and water conductivities dropped well below 10% of their initial value. Maximum impact was observed around 6–12
months after compaction, and microbial communities showed resilience in lightly but not in severely compacted soils 4 years post disturbance. Bacteria capable of anaerobic respiration,
including sulfate, sulfur, and metal reducers of the Proteobacteria and Firmicutes, were significantly associated with compacted soils. Compaction detrimentally affected ectomycorrhizal
species, whereas saprobic and parasitic fungi proportionally increased in compacted soils. Structural shifts in the microbiota were accompanied by significant changes in soil processes,
resulting in reduced carbon dioxide, and increased methane and nitrous oxide emissions from compacted soils. This study demonstrates that physical soil disturbance during logging induces
profound and long-lasting changes in the soil microbiome and associated soil functions, raising awareness regarding sustainable management of economically driven logging operations.
Soil is an essential component of forest ecosystems, mediating fundamental nutrient and energy flow patterns that ensure forest productivity, sustain biodiversity and regulate climate
stability (Bonan, 2008; Reay et al., 2008; Dominati et al., 2010; Normile, 2010). Soils are dynamic biological matrices featuring a complex microbiome that has an integral role in virtually
all ecosystem processes (Barrios, 2007). At the system level, microbial metabolism regulates ecosystem functioning and modulates resistance and resilience to perturbations (Allison and
Martiny, 2008). It is likely that measuring the microbial community structure and associated functions can improve the ability (1) to monitor alterations of the soil system after
disturbances, (2) to evaluate its capacity to recover and perhaps (3) to detect adverse effects in ecosystem functioning before they are irreversible.
Soil compaction has been recognized as a major disturbance associated with forest management (Van-Camp et al., 2004). Economically efficient harvesting requires the use of heavy machines,
causing severe compaction of the soil particularly during wet conditions and along skid trails and landings (Grigal, 2000; Marshall, 2000). Alterations in soil porosity affect pore
connectivity, water infiltration, air permeability, temperature, rooting space, nutrient flow and biological activity (Greacen and Sands, 1980; Kozlowski, 1999; Richard et al., 2001; Mooney
and Nipattasuk, 2003), often resulting in increased surface runoff, soil erosion, nutrient leaching and greenhouse gas emission (Worrell and Hampson, 1997; Powers et al., 2005). As a
consequence, the soil system can suffer substantial, persistent and sometimes irreversible damage, which ultimately reduces forest productivity and ecosystem functionality. Given that the
affected area can range between 10 and 40% of the total logged stand, the impact on the ecosystem can be substantial (Grigal, 2000; Luckow and Guldin, 2007; Frey et al., 2009).
The negative impact of soil compaction caused by logging on physicochemical properties has been demonstrated for years (for example, McNabb et al., 2001; Horn et al., 2007; Ampoorter et al.,
2010). In contrast, only few studies have observed significant effects on microbial properties (Dick et al., 1988; Jordan et al., 2003; Schnurr-Pütz et al., 2006), and most such
investigations reported inconsistent, equivocal or non-significant effects (Jordan et al., 1999; Chow et al., 2002; Li et al., 2004; Shestak and Busse, 2005; Busse et al., 2006; Mariani et
al., 2006; Tan et al., 2008; Jennings et al., 2012). These observations led to the general notion that microbial communities exhibit high degrees of resistance and resilience to compaction
and might not adequately reflect the ecological consequences. These previous studies commonly measured bulk parameters such as microbial biomass or were limited by the unavailability of
techniques with high taxonomic resolution to resolve the complex structure of the microbiota. With the recent advent of molecular tools, there is increasing evidence that effects of soil
compaction on microbial structure and function are probably substantial and long lasting (Frey et al., 2009, 2011; Hartmann et al., 2012).
Applying high-throughput pyrosequencing (Margulies et al., 2005) of bacterial and fungal ribosomal markers, Hartmann et al. (2012) recently described the microbial community structure in
differently compacted forest soils at far greater depth than previously possible. This large-scale survey demonstrated that logging-induced soil compaction persistently alters the
microbiota. However, four factors limited the conclusive evaluation of microbial resistance and resilience in these compacted soils. First, the experimental design did not allow for
completely separating effects caused by soil compaction from those caused by biomass removal. Second, the study did not assess soil functions that are directly dependent on physical soil
properties such as air permeability and water conductivity in order to relate changes in community structure to its edaphic background. Third, the study did not monitor the microbial
response over time in order to evaluate initial resistance and long-term resilience of the system. Finally, the study did not gather process information that could serve as proxy for changes
in ecosystem functioning and to evaluate functional redundancy of the structural changes.
Here, we present a study that fills the gaps indicated above and advances our understanding of the resistance and resilience of the forest soil ecosystem to compaction. Recently, Frey et al.
(2011) reported on alterations in methanogenic community structure and methane fluxes in two controlled field experiments, in which skid trails differing in compaction intensity were
generated by logging vehicles. Driven by these findings, we launched a comprehensive assessment of physicochemical and microbial characteristics in these soils to examine resistance and
resilience of microbial community structure and associated soil functions to compaction.
The field experiment was conducted in Spring 2007 and 2008 at two forest sites in Switzerland, Ermatingen and Heiteren, respectively. The two independent experiments represented two
different scenarios in that the sites differed in their susceptibility to compaction (that is, soil texture) as well as in the degree of compaction induced (that is, ground contact
pressure). A detailed description of the study sites and the traffic experiments has been published previously (Frey et al., 2011). The texture at both sites was loamy, but the soil at
Ermatingen (17% clay, 47% silt and 36% sand, pH 4.6) was characterized by around 50% more clay and a higher pH when compared with the sandy soil at Heiteren (8% clay, 43% silt and 49% sand,
pH 4.0). In order to generate different degrees of compaction, soil moisture contents along projected traffic lanes (independent triplicates within 20 m distance of each other) were adjusted
to 0.17 (plastic limit, C1) and 0.35 (liquid limit, C2) gram H2O per gram of soil and equilibrated for 2 days before compaction. Compaction was induced using a fully loaded forwarder with
four passes at Ermatingen (weight of 26 tons, ground contact pressure of 240–320 kPa) and an unloaded skidder with four passes at Heiteren (14 tons, 210–280 kPa). Unaffected areas in the
vicinity of the compacted soils (that is, one meter from the center of the traffic lane) served as no impact controls (C0). Thus, the study comprised three independent wheel tracks
(triplicates) per forest site with no (C0), light (C1) and severe (C2) soil compaction per lane. The experimental layout at Ermatingen is provided as Supplementary Figure 1.
A detailed soil sampling protocol has been published previously (Frey et al., 2011). Triplicate cores from the topsoil were collected in each replicated traffic lane at a depth of 3–7 cm
using steel cylinders with a volume of around 100 cm3. The tire profiles generate a mixed and sometimes puddled stratum between the tread elements, where new structure can build up quickly
after natural drying-rewetting cycles. Hence, this stratum has limited potential to depict soil compaction and it is more suitable to sample the stratum below this depth. Furthermore, by
avoiding the top 3 cm, we also excluded the litter material that was constantly falling into the tire imprint along the skid trails. Samples for soil physical measurements were collected
after 1–4 days, and within-lane replicates were analyzed individually. Samples for microbial analyses were collected at the same locations as for the physical measurements after 30, 180,
365, and 1460 days, whereas within-lane replicates were pooled for further analysis.
Bulk density was determined gravimetrically after oven drying at 105 °C and defined as the mass of dry soil divided by the sample volume. Total pore volume was determined as mass difference
between saturated and oven-dried samples. Pore size distribution was determined using the standard pressure-plate procedure for soil moisture retention curve (Hartge and Horn, 1992).
Proportions of pore size classes were calculated on the basis of the measured water desorption characteristics (Tebrügge and Düring, 1999). Saturated hydraulic conductivity (kf) was measured
using an ICW soil water permeameter model 09.02 (Eijkelkamp Agrisearch Equipment, Giesbeek, the Netherlands) after soil samples have been water saturated for 72 h. Air permeability (ki) was
measured after each draining step (30–300 kPa) using an air permeameter model 08.07 (Eijkelkamp) (Gysi et al., 1999).
Net soil-atmosphere fluxes of methane (CH4), carbon dioxide (CO2) and nitrous oxide (N2O) were measured in the triplicate skid trails in monthly intervals between September and December of
2008 (medium-term response) and 2012 (long-term response). Without a priori knowledge of the compaction effects, the purpose of measuring the gas fluxes was to assess broad functional end
points related to carbon and nitrogen turnover in these soils, which ultimately reflect the degree of disturbance as well as the functional resilience in this system. Fluxes were measured as
described recently (Hartmann et al., 2011; Hartmann and Niklaus, 2012; Poll et al., 2013). Static chambers were installed in close proximity to the soil sampling spots a few weeks before
the measurements. Headspace gas samples of 30 ml (total headspace volume 7.9 l) were collected at intervals of 5, 20 and 35 min after chamber closure and analyzed using an Agilent 7890 gas
chromatograph (Agilent Technologies, Palo Alto, CA, USA). Concentrations were calibrated against standard gas mixtures simultaneously analyzed with every batch of samples, and gas fluxes
were calculated by linear regression of gas concentration against time, accounting for air temperature and pressure at the time of sampling. For each period of measurement (medium- and
long-term), average gas fluxes were calculated across the 4-month period, representing an unbiased estimate of the fluxes integrated over time.
Spatial and temporal treatment effects on physical soil properties and gas fluxes were examined using a repeated measures factorial analysis of variance (ANOVA) followed by Fisher’s
protected least significant difference (LSD) post-hoc test, which reasonably controls the familywise error rate as long as not more than three treatment groups are compared (Meier, 2006).
Significance levels of overall pairwise tests were adjusted for multiple comparisons using the Holm method (Holm, 1979). Non-normal data were square-root or log transformed.
Total nucleic acids were extracted in duplicates from 0.5 g sieved soil (2 mm) using a bead-beating procedure (Frey et al., 2008). DNA concentrations were determined using PicoGreen
(Molecular Probes, Eugene, OR, USA). PCR amplification of partial bacterial small-subunit ribosomal RNA genes (region V1–V3 of 16S) and fungal ribosomal internal transcribed spacers (region
ITS2) was performed using 50 ng of soil DNA as described previously (Hartmann et al., 2012). Each sample was amplified in triplicates and pooled before purification with Agencourt AMPure XP
beads (Beckman Colter, Berea, CA, USA) and quantification with the Qubit 2.0 fluorometric system (Life Technologies, Paisley, UK). Amplicons were unidirectionally sequenced using 454
pyrosequencing at the Functional Genomics Center Zurich (Switzerland) using the GS-FLX Titanium technology (Roche 454 Life Sciences, Branford, CT, USA).
Relative abundances of bacterial and fungal communities were determined by quantitative PCR on an ABI7500 Fast Real-Time PCR system (Applied Biosystems, Foster City, CA, USA) with the same
primers and cycling conditions as used for the pyrosequencing approach. PCR was performed using 2.5 ng DNA in a total volume of 25 μl containing 0.5 μM of each primer, 0.2 mg ml−1 bovine
serum albumin and 12.5 μl of QuantiTect SYBR Green PCR master mix (Qiagen, Valencia, CA, USA). Three standard curves per target region (correlations ⩾0.997) were obtained using 10-fold
serial dilutions (10−1 to 10−9 copies) of plasmids generated from cloned targets. Data were converted to represent average copy number of targets per gram of soil dry weight. Spatiotemporal
treatment effects were examined using repeated measures factorial ANOVA of log-transformed copy numbers followed by Fisher’s least significant difference and Holm adjustments.
Flowgrams were trimmed to low quality signals (Quince et al., 2011) and demultiplexed using MOTHUR (Schloss et al., 2009) allowing one mismatch to the sample-specific barcode and two
mismatches to the target-specific primer (Schloss et al., 2011). Flowgrams were denoised using PYRONOISE (Quince et al., 2009) in MOTHUR to eliminate sequencing errors. The bacterial
16SV1-V2 (that is, region spanning V1 and V2) and the fungal ITS2 region were verified and extracted using V-XTRACTOR (Hartmann et al., 2010) and its ITS counterpart (Nilsson et al., 2010)
in order to remove spurious reads and compare phylogenetically consistent regions (Schloss, 2012). Sequences were further denoised using SEQNOISE (Quince et al., 2011) in MOTHUR to eliminate
PCR single-base errors. Potentially chimeric sequences were removed using the de novo detection mode in UCHIME (Edgar et al., 2011).
Curated sequences were clustered into operational taxonomic units (OTUs) using the unsupervised Bayesian clustering algorithm CROP (Hao et al., 2011) and an identity threshold of 97%. All
reads in a given OTU were assigned to curated taxonomic databases using the naïve Bayesian classifier (Wang et al., 2007) in MOTHUR and a minimum bootstrap support of 60%. Bacterial and
fungal reads were queried against GREENGENES (DeSantis et al., 2006; McDonald et al., 2011) and UNITE (Abarenkov et al., 2010), respectively. The consensus taxonomy of each OTU was
determined using MOTHUR as the taxonomic path represented by at least 80% of the sequences. On the basis of the consensus taxonomies, abundance data for OTUs at specific taxonomic ranks
(species, genus, family, order, class and phylum) were merged and used to generate taxonomic rank-specific matrices that were the basis for the network and the taxa-treatment association
analyses.
Estimates of alpha diversity were calculated in MOTHUR. These estimates included the observed OTU richness, the Good’s coverage (Good, 1953), the parametric ‘best fit’ richness estimation
CatchAll (Bunge et al., 2012) and the Shannon diversity index (Magurran, 2004, Haegeman et al., 2013). As alpha diversity measures are sensitive to differences in sampling effort, estimates
were calculated based on data sets that were randomly subsampled to the same number of sequences. Spatiotemporal treatment effects on alpha diversity estimates were examined using a repeated
measures factorial ANOVA followed by Fisher’s least significant difference and Holm adjustments.
Multivariate analysis of beta diversity was performed according to the recommendations by Anderson and Willis, 2003 who proposed four components in the analysis of multivariate ecological
data: (1) a robust unconstrained ordination to determine structural similarities among communities; (2) a compatible constrained analysis with reference to a specific hypothesis; (3) a
rigorous statistical test of the hypothesis; and (4) characterization of the taxa responsible for the multivariate patterns. In accordance with this strategy, we used the following
techniques for the corresponding purposes: (1) principal coordinate analysis (PCO; Gower, 1966); (2) canonical analysis of principal coordinates (CAP; Anderson and Willis, 2003); (3)
analysis of similarities (ANOSIM; Clarke, 1993) and permutational multivariate analysis of variance (PERMANOVA; Anderson, 2001); and (4) taxon-treatment association analysis (De Cáceres and
Legendre, 2009).
Inter-sample Bray-Curtis similarities (Bray and Curtis, 1957) were calculated based on standardized and square root transformed OTU abundances (Hartmann et al., 2012). ANOSIM, PERMANOVA, and
CAP were run with 105 permutations as routines in PRIMER6+ (Clarke and Gorley, 2006). Both PERMANOVA and ANOSIM were applied in parallel as they are complementary, the first offering
analyses of complex designs including interactions and the second providing a universal measure of group separation while being fully non-parametric and thus robust in its application to
ecological data (Lek et al., 2011). Permutational analysis of multivariate dispersion (PERMDISP; Anderson, 2006) was used to control the influence of multivariate heterogeneity among a
priori groups. The discriminative power of permutation-based analyses for pairwise comparisons of triplicates is limited by only 10 possible permutations (Clarke, 1993). In order to test
compaction effects within each site and sampling date, the within-group to among-group Bray-Curtis dissimilarities were compared using the Wilcoxon rank sum test (Wilcoxon, 1945) including
Holm adjustments for multiple comparisons.
The degree of preference of each taxon for the target group relative to the other groups (that is, the point biserial correlation coefficient R) was determined using taxon-treatment
association analyses with all possible group combinations (De Cáceres and Legendre, 2009; De Cáceres et al., 2010). Singletons and doubletons, that is, taxonomic units which were represented
by only one or two sequences across the whole data set were not included in the analysis. The analyis was peformed in GINKGO (Bouxin, 2005) with 106 permutations. P-value adjustments for
multiple comparisons were performed using the false discovery rate (FDR; Storey, 2002). Q-values were determined using the software QVALITY (Käll et al., 2009), and associations were
considered significant with an FDR of 5% (q
Trending News
Kourtney Kardashian hides her fit and toned physique under sweats as she enjoys casual coffee run in LAKourtney Kardashian hides her fit and toned physique under sweats as she enjoys casual coffee run in LA By ANNITA KATEE ...
LH: Latest Articles, Analysis and Profile | South China Morning PostAdvertisementLH+ FOLLOWresult22.ART22 Dec 2012 - 1:46AMRelated TopicsNo Related Topics...
Flavored e-cig bans & FDA seizes foodMorning RoundsFlavored e-cig bans & FDA seizes food By Megan ThielkingNov. 12, 2018ReprintsAndrew Harnik/APSTAT Morning ...
Gigantic, ancient armoured 'b rex' fish discoveredScientists have discovered an ancient fish that dates back 370 million years. Fossil bones from the skull of Bothriolepi...
Valley pbs community byyou | heritage fresno: a look at central valley architecture | season 2013 | episode 44Season 2013 Episode 44 | 1h 38s Learn the history of valley architecture from Stockton to Bakersfield Heritage Fresno ho...
Latests News
Resistance and resilience of the forest soil microbiome to logging-associated compactionSoil compaction is a major disturbance associated with logging, but we lack a fundamental understanding of how this affe...
Residents to open access to park : land use: monarch point homeowners assn. Agrees to allow parking on a private road and to pay for a new entrance toLAGUNA NIGUEL — An agreement has been reached between the county and Monarch Point, an exclusive gated community where r...
Sudan's al-Bashir will not attend Saudi summit for "special reasons"Sudanese President Omar al-Bashir will not attend a gathering in Saudi Arabia on Saturday where U. S. President Donald T...
Rangers assistant Dan Muse takes Penguins job that Mike Sullivan leftRangers head coach Mike Sullivan officially has to bring in two new assistant coaches.Dan Muse, who was the last remaini...
Nightmare cruise tours completely wrong country as passengers left fumingA cruise company has sparked controversy after passengers planning a two-week tour of New Zealand were forced to visit T...